
Vehicle-body vibration measurement with Siemens
See More · Know More.
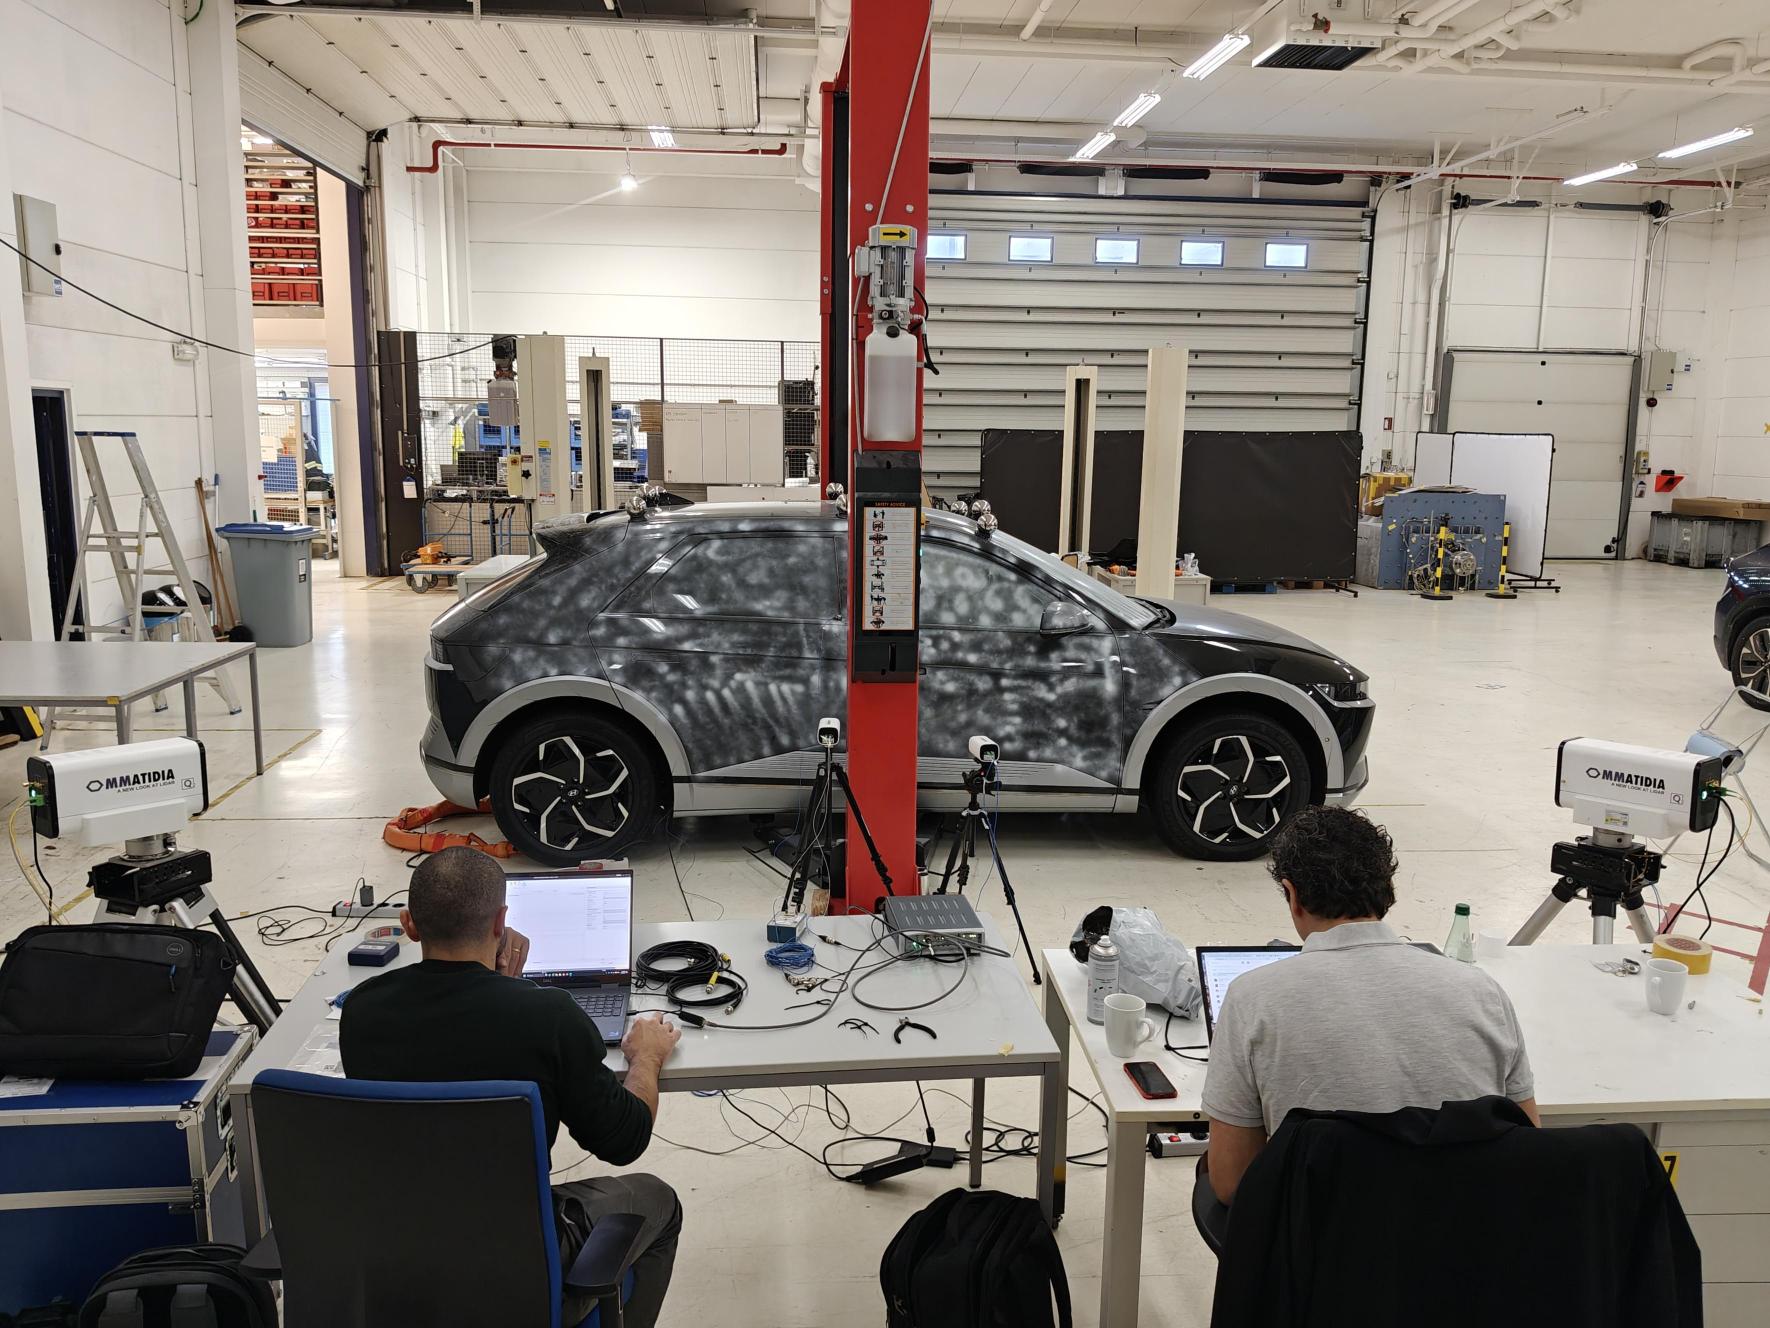
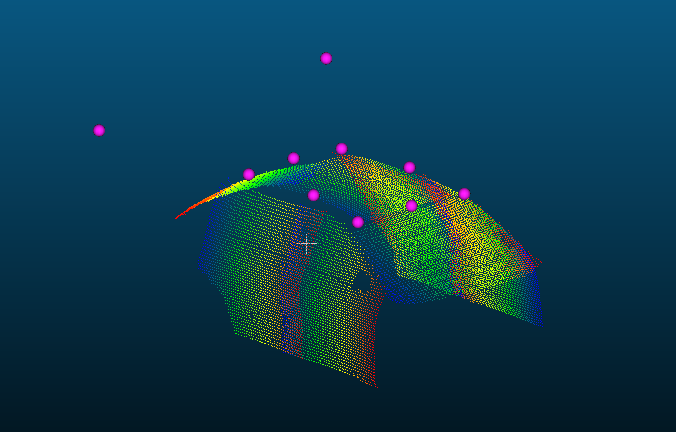
Seeing how a vehicle body moves means connecting vibration measurements to the surfaces that produced them. In a measurement campaign with Siemens in Leuven, Ommatidia used portable optical measurement equipment to capture a Hyundai vehicle from seven viewpoints and bring the views together in a common geometric model. The full seven-view dataset contains 7,739 surface measurement points.
Data capture for the model shown took a little over one day.
The resulting visualizations connect local surface response with the wider vehicle geometry, giving engineers a spatial view of the vibration patterns they are investigating.
Our team flew in with the equipment and carried out the measurements at the test site using two Q2 scanning laser-Doppler vibrometers and a SpeedSync reference. This approach brings optical vibration measurement to the vehicle, rather than requiring the vehicle to travel to a dedicated measurement installation.
For a prototype test, the starting point is the engineering question: which panels matter, which frequency bands need investigation, and what access is available around the structure? Those choices guide the viewing positions and the coverage required.
A single viewpoint cannot see every surface of a vehicle. Measurements from different positions therefore need a common geometric reference.
Reference spheres provided shared geometric markers for aligning and stitching the separate views. This brought the seven views into a common coordinate system, connecting local measurements to the vehicle geometry and making the spatial response easier to inspect across the captured surfaces.
The seven measurement views cover the front and rear doors on each side, the rear window, the windshield and the roof.
The measured geometry provides local surface normals: the directions perpendicular to the surface at each point. These normals enable correction for the projection between the laser line of sight and the surface-normal motion. For this dataset, the line-of-sight response is divided by the cosine of the incidence angle and resolved along the surface normal, assuming motion normal to the surface. This places the corrected response in the common vehicle coordinate system.
When an application requires a triaxial velocity map, measurements of the same surface area can be combined from at least three independent viewing directions, with corresponding points, consistent phase references and suitable viewing geometry. That capability extends the workflow to three-component velocity reconstruction. The vehicle animations here use the surface-normal workflow.
The full dataset is exported in Universal File Format (UFF), with the measured point geometry and its vibration responses linked in one self-contained file. Prepared for direct import into Simcenter Testlab, the export preserves the association between each surface point, its response and the common reference. Because the measured point geometry travels with the responses, this export avoids a separate part-model import and manual point-to-response association for that geometry. Keeping the information together helps save data-preparation time before modal analysis, so engineers can focus on the structural response.
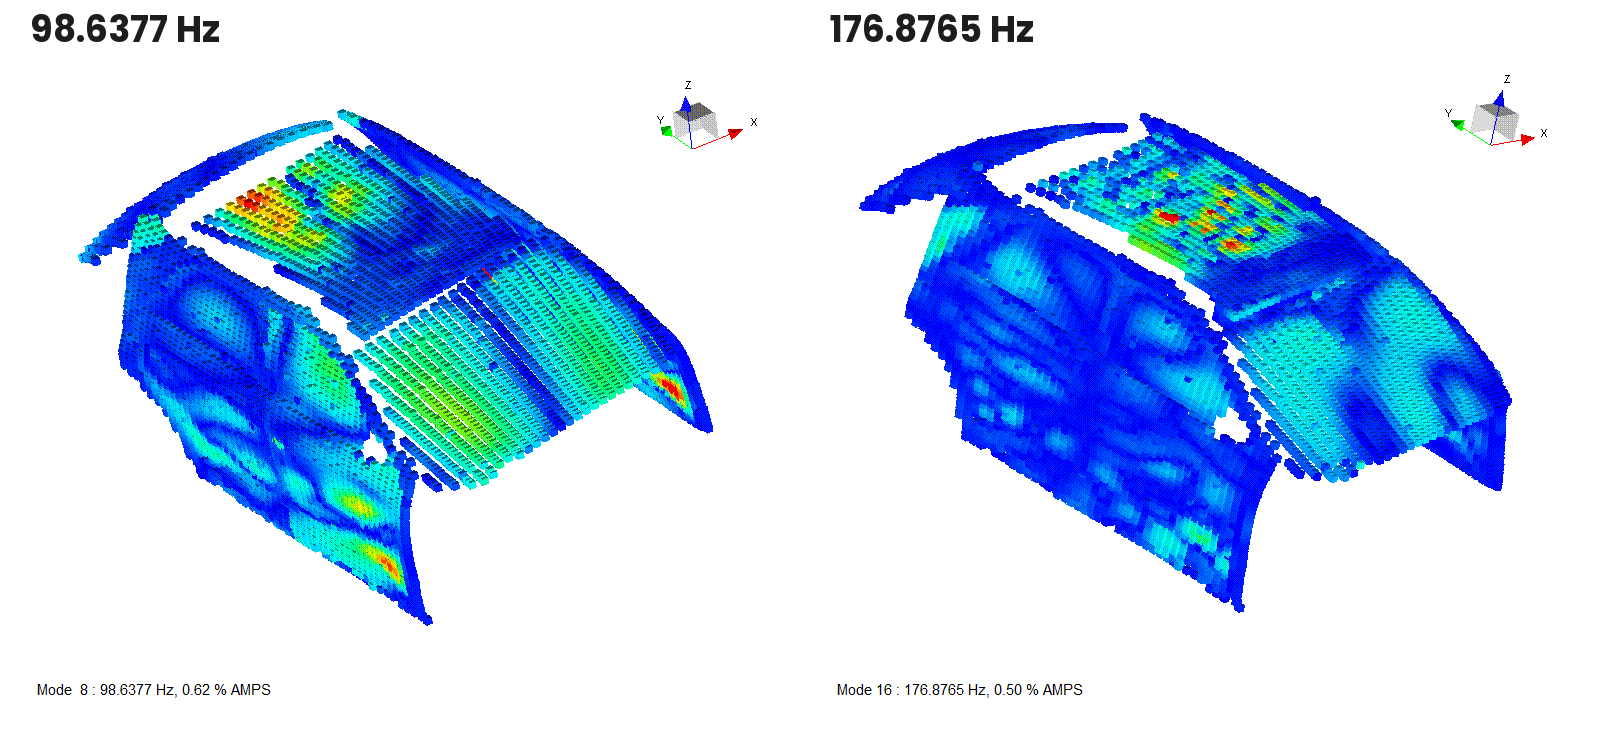
The video moves from the measurement setup to two preliminary response visualizations at 98.6 Hz and 176.9 Hz.
At these frequencies, the animations show different spatial patterns across the captured vehicle surfaces. Seeing those patterns on the geometry helps engineers discuss which regions move together and where the response changes across a panel or between regions.
Playback makes the spatial motion easy to inspect; its speed and deformation are illustrative, rather than calibrated physical time or displacement.
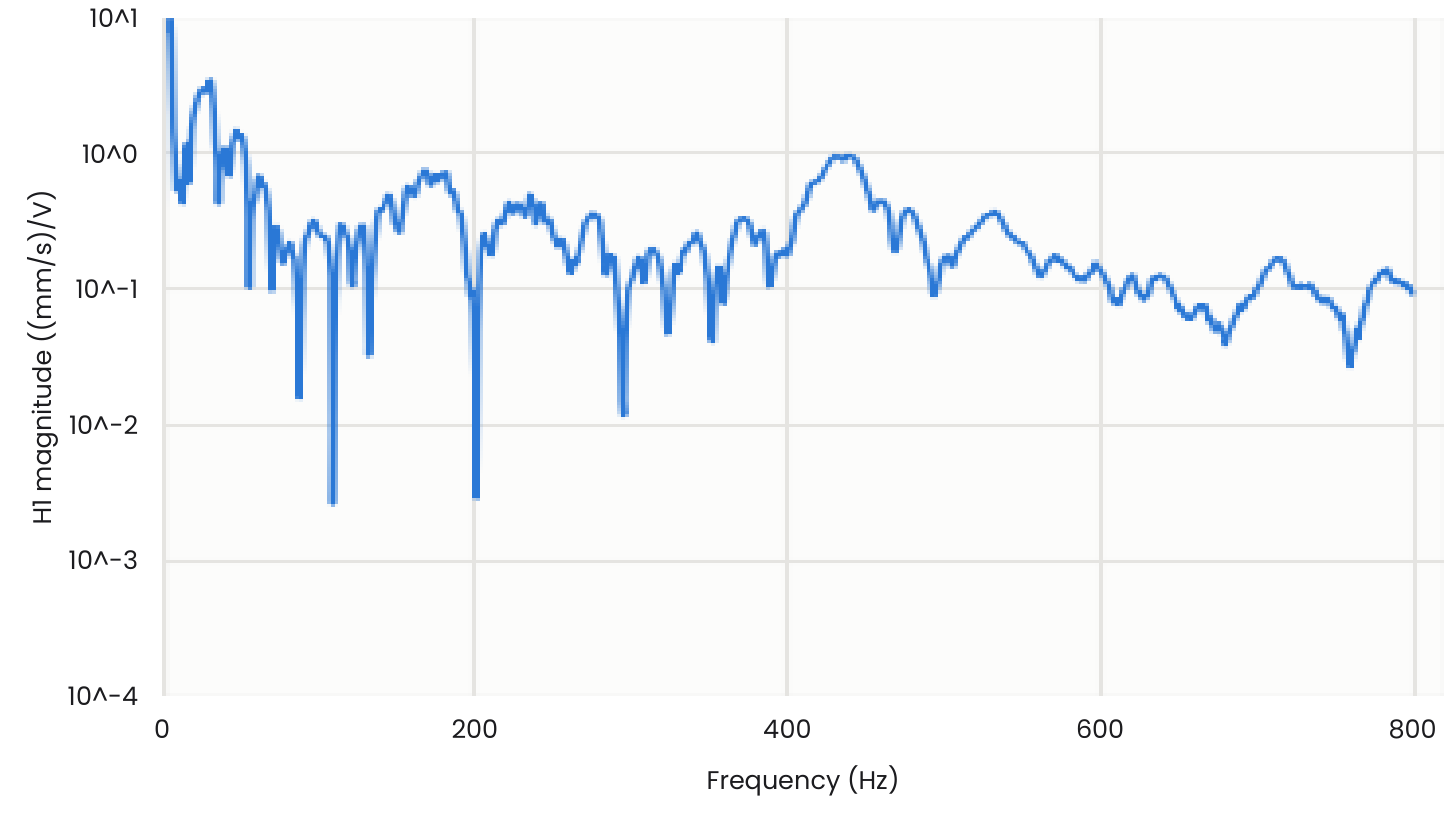
The selected optical-channel response below links vibration to the recorded excitation-drive voltage. Its H1 magnitude is expressed in (mm/s)/V, providing frequency-response context alongside the spatial visualizations.
For automotive noise, vibration and harshness work, a spatial response map can help frame the next engineering question: which region should be investigated more closely, which frequency range deserves attention, and what reference measurements or analysis are needed next?
The same planning approach can be used to scope optical vibration measurements on other prototypes and structures. Start with the target, the question and the output your engineering team needs, then define the optical coverage and analysis together.
Explore the measurement setup, multi-view stitching, response visualizations and export workflow in the application note. Complete the download form to receive it.
Have a vehicle prototype, panel or structure whose vibration you need to understand? Contact sales@ommatidia.tech with the part or vehicle you want to measure, the frequency range of interest and the question you need to answer. We can discuss the measurement coverage, site access and outputs for your test.
Measurement campaign, geometry registration and stitched data preparation: Ommatidia, working with the Siemens team in Leuven.
Preliminary modal analysis and the 98.6377 Hz and 176.8765 Hz response visualizations: Simone Manzato and the Siemens Digital Industries Software team.
Our AI will connect you with expert advice.