AUTOMOTIVE INSPECTION · FORD–ALMUSSAFES PILOT

Windscreen adhesion testing at Ford–Almussafes

A pilot at Ford–Almussafes used Ommatidia’s Q2 to compare the vibration patterns of windscreens on four vehicles. In the 180–248 Hz band, both vehicles with documented adhesion faults differed more from the reference vehicles than the two references differed from each other. The result gives automotive teams a concrete starting point for developing non-contact adhesion assessment.

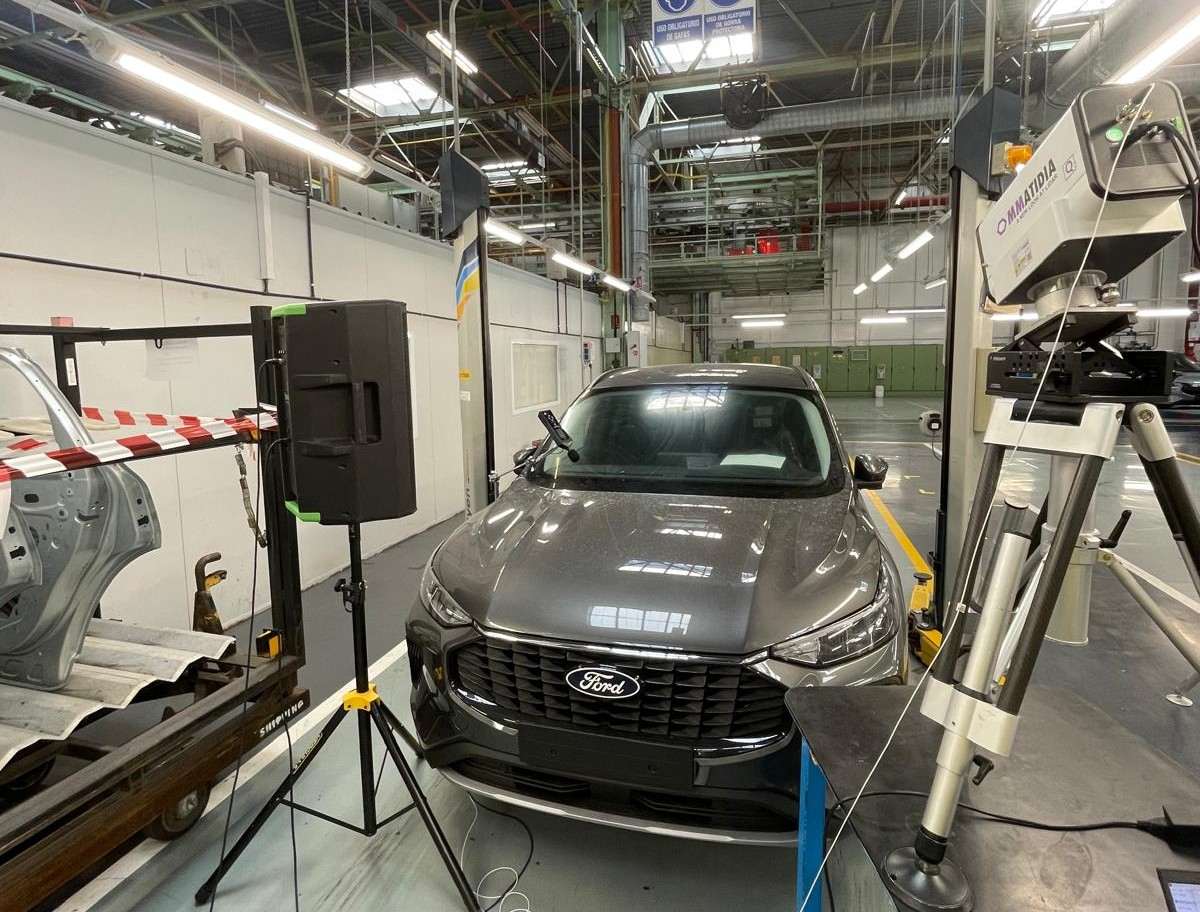
Q2 laser vibrometer beside a vehicle and acoustic excitation source at Ford–Almussafes
The plant setup: acoustic excitation in front of the vehicle and non-contact Q2 vibration measurement. Pilot report, Figure 1.

Reading the bond through the vibration pattern

A windscreen, its adhesive and the surrounding body form a coupled mechanical structure. Measuring how the glass responds to excitation provides a way to investigate its attachment conditions without attaching vibration sensors to the glass.

The pilot compared relative amplitude and phase at equivalent positions near the windscreen edge. Its modal dissimilarity index, IDM = 1 − MAC, expresses the difference between these spatial response patterns. MAC is the Modal Assurance Criterion: similar patterns produce a low IDM, while more different patterns produce a higher value.

Four vehicles, one comparison workflow

The two-day campaign compared two reference vehicles with two vehicles with adhesion faults. One fault condition concerned the glass–adhesive interface; the other concerned the adhesive–metal interface.

Acoustic sweeps excited the structure from 55 to 2,000 Hz, at output levels of 1 and 2 Vpp. Q2 measured vibration without contact, while a PCE-322A sound-level meter recorded an acoustic reference near the windscreen. Across the four vehicles, the dataset comprised 63 acquisitions and 119 complete sweeps.

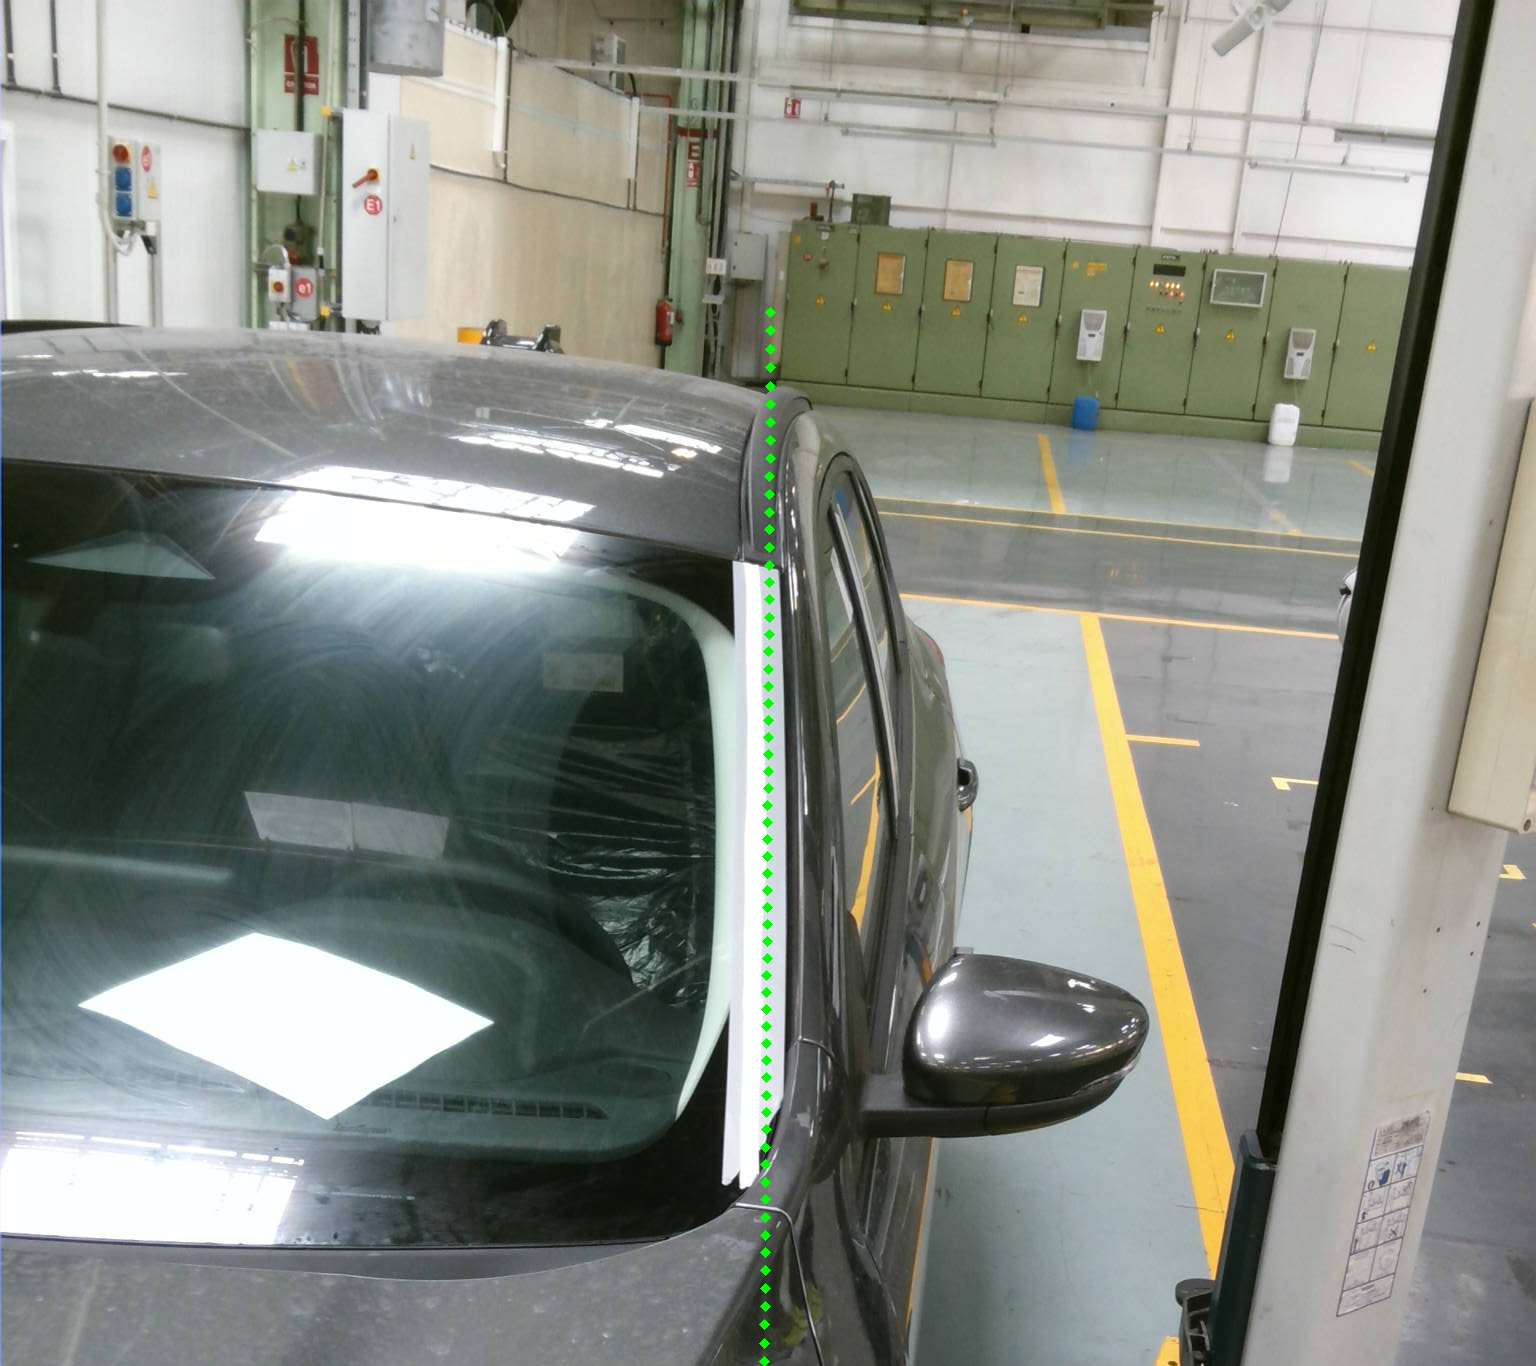
Each acquisition recorded 65 channels simultaneously. The analysis selected approximately 38–39 positions on the glass, then compared equivalent physical locations across vehicles. Repeating the analysis with different point selections, sweeps and frequency bands tested the consistency of the spatial comparison.

Green measurement-point markers near the windscreen edge in the pilot report camera view
The measurement-point view near the windscreen edge. Pilot report, Figure 1.

A consistent difference in 180–248 Hz

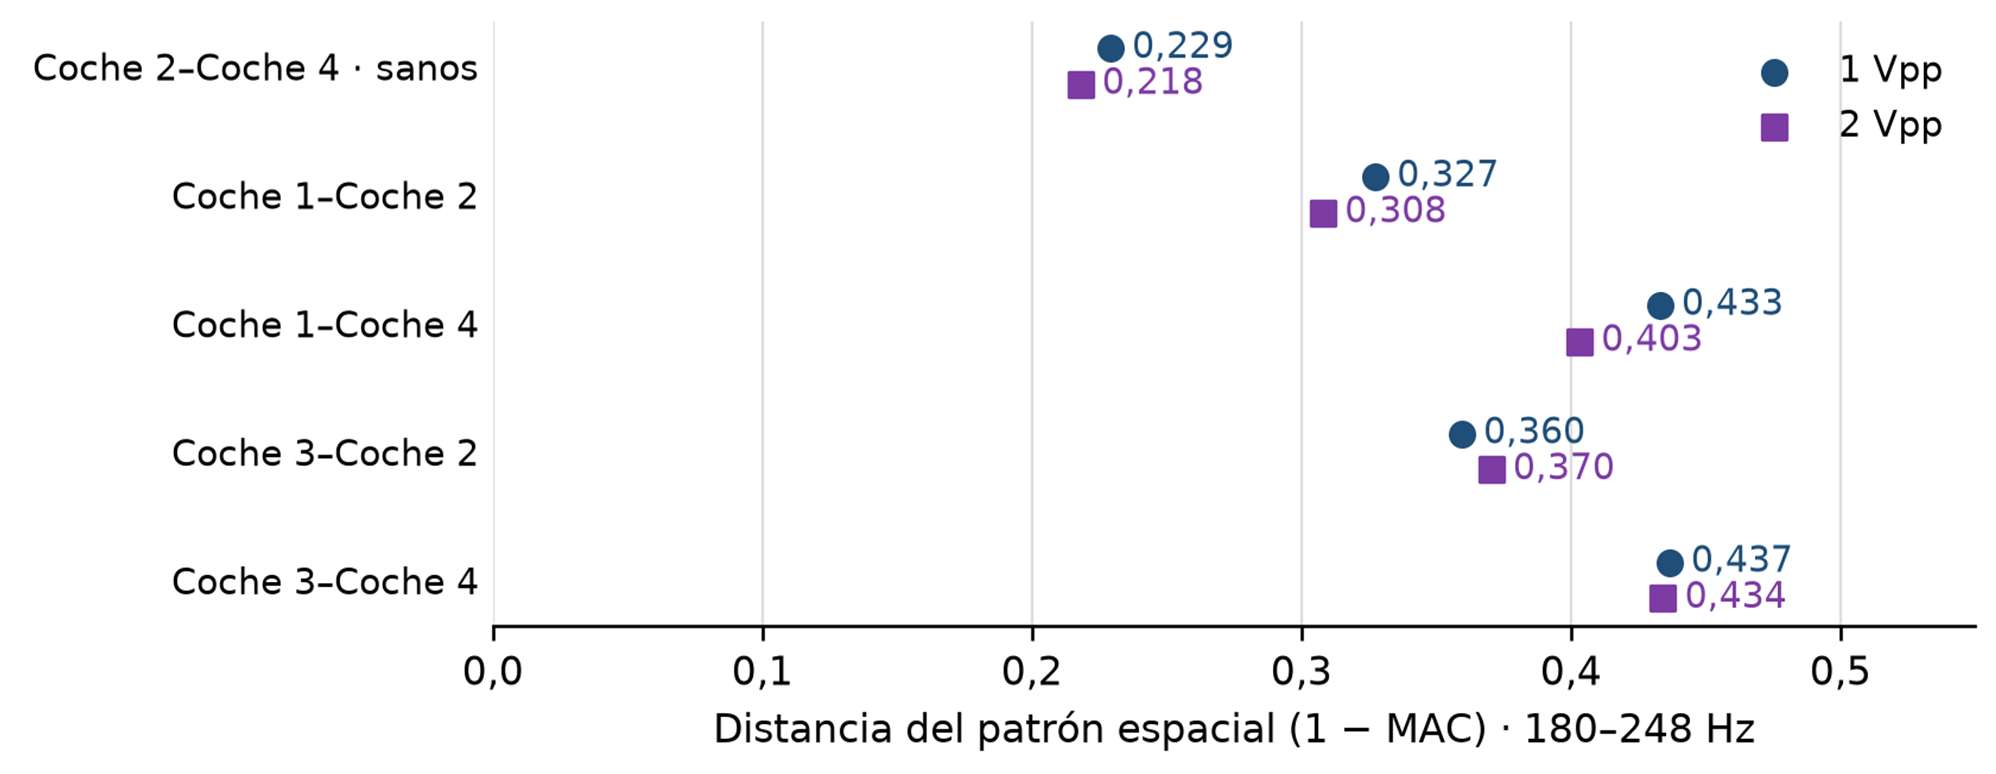
In the initial eight-position comparison, the reference-to-reference median dissimilarity was 0.229 at 1 Vpp and 0.218 at 2 Vpp. Every fault-to-reference comparison was higher, ranging from 0.308 to 0.437 across the two excitation levels.

The same ordering held for both vehicles with faults, at both excitation levels, across all five point selections that covered the full measured region. That consistency makes the spatial vibration pattern a promising global indicator to take into a larger vehicle campaign.

Report chart showing reference-to-reference and fault-to-reference modal dissimilarity at 1 and 2 Vpp in 180–248 Hz
Modal dissimilarity in 180–248 Hz at 1 Vpp (circles) and 2 Vpp (squares). Coche 2 and Coche 4 are the reference vehicles; Coche 1 and Coche 3 have adhesion faults. Each plotted value is a median across measurement configurations. Original Spanish labels retained. Pilot report, Figure 2; technical annex A5.

Why adhesion changes the modal shape

The adhesive bond connects the windscreen to the vehicle body and transfers load around its perimeter. Where adhesion is lost, that restraint changes: the glass can move differently relative to the surrounding structure. This redistributes the vibration pattern across the windscreen, changing the relative motion of different regions.

The animation makes this spatial response visible. Different parts of the glass move by different amounts and at different phases of the cycle. Comparing these patterns at equivalent measurement positions is the principle behind the pilot’s modal dissimilarity index: a change in attachment conditions can change the shape of the response, giving Q2 a non-contact route to assessing the bond.

Windscreen vibration animation supplied by Ommatidia, illustrating the spatial motion compared in modal-shape analysis.

Discuss your inspection application

For automotive teams investigating non-contact bond assessment, Ommatidia can help define the measurement geometry, excitation and comparisons for a focused pilot. Tell us about your component and inspection requirements to plan the next measurement.

Source: Ommatidia’s Ford–Almussafes pilot report, Figure 1–2, and technical annexes A1, A4–A6 and A11, shared with the Ford team on 29 September 2026. Photographs and result chart reproduced from that pilot report.

Ommatidia Upgrade & Trade-In Program

Upgrade to Ommatidia’s latest Laser RADAR technology and unlock more capability for your next measurement challenge. Whether you are expanding an existing setup or replacing an older system, we offer tailored upgrade options with discounts of up to 40%.

If you are currently using another manufacturer’s system, send us your model and measurement requirements. We will review your trade-in possibilities, identify the best Ommatidia configuration, and outline a practical upgrade path for your team.

Discuss your upgrade or trade-in