APPLICATION NOTE · OPTICAL VIBROMETRY
This single optical acquisition at 392 Hz shows distinct resonator responses across bright reflective targets and weak metal returns. The assembly was not designed specifically around the instrument. Its measured field spans 51.93 dB of coherent-return contrast, demonstrating useful vibration detail in a demanding optical scene.
Coherent-return contrast in the measured scene
Median footprint on the recorded angular grid
Resonator positions assessed with a common method
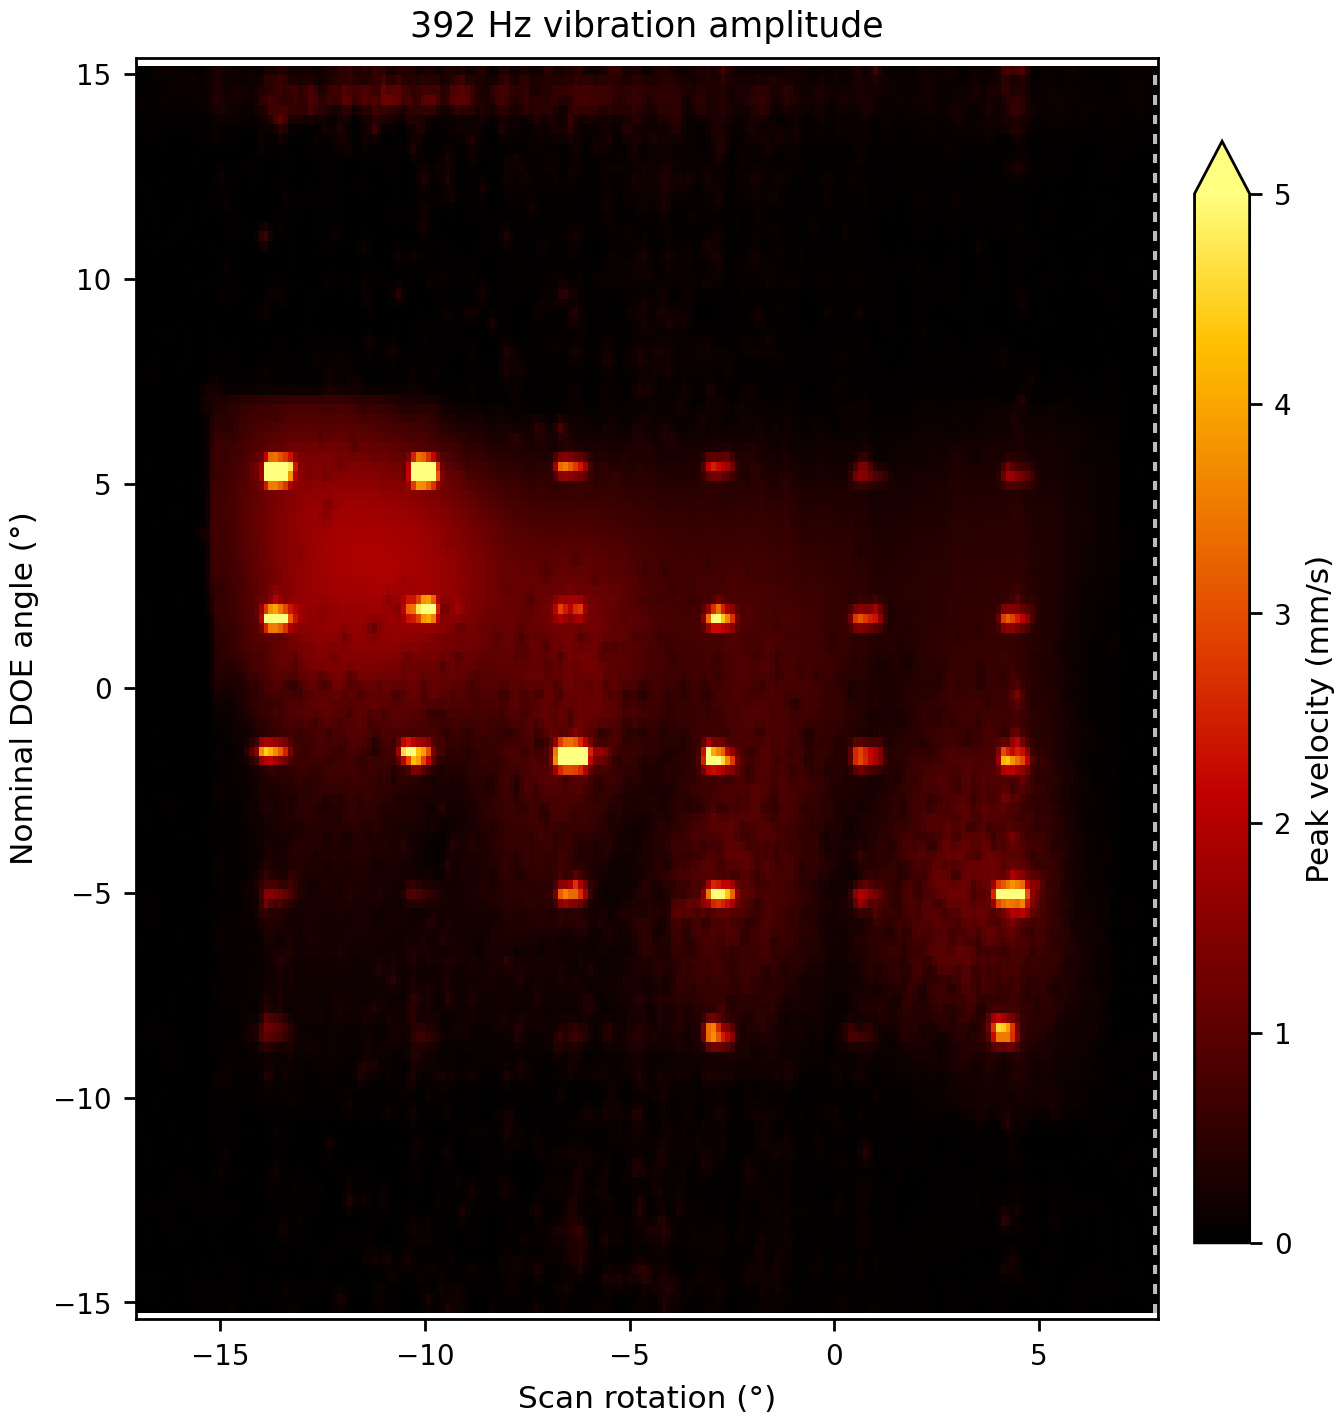
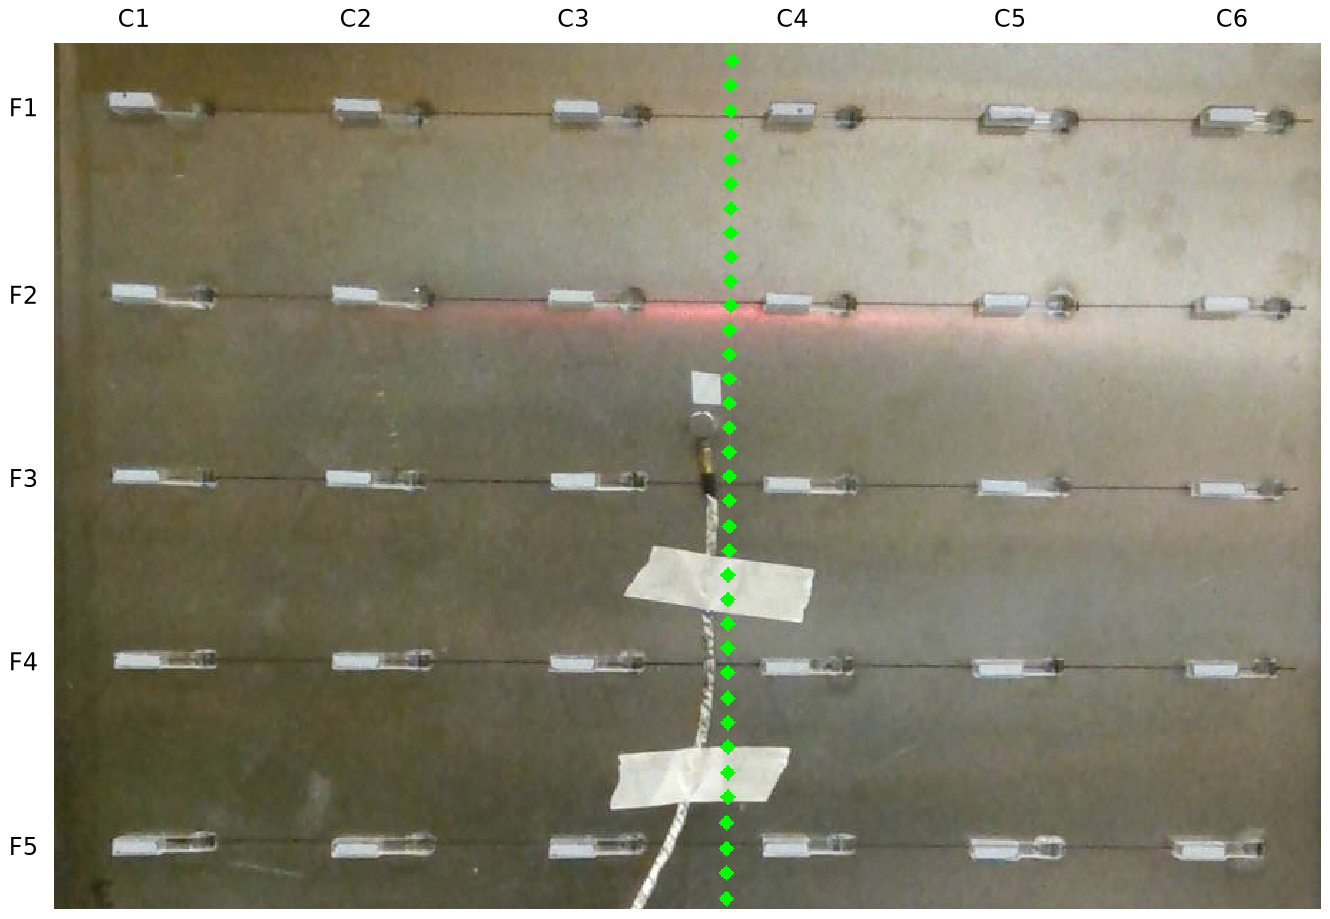
The plate combines retroreflective tabs, a broad semispecular reflection and weak diffuse return. Ommatidia measured this varied optical scene and resolved the resonator response in amplitude, phase and time. The 51.93 dB figure describes the return contrast observed on the assembly.
Processing the same recorded signals produces a more concentrated vibration response. Across 30 fixed regions, the median footprint is 37.5% smaller than the reference, with the median regional peak essentially unchanged. The technical report explains the comparison and the local variations.
The map shows the complete measured field. The footprint result describes this 392 Hz comparison on the recorded angular grid; the technical report provides the method and local results.
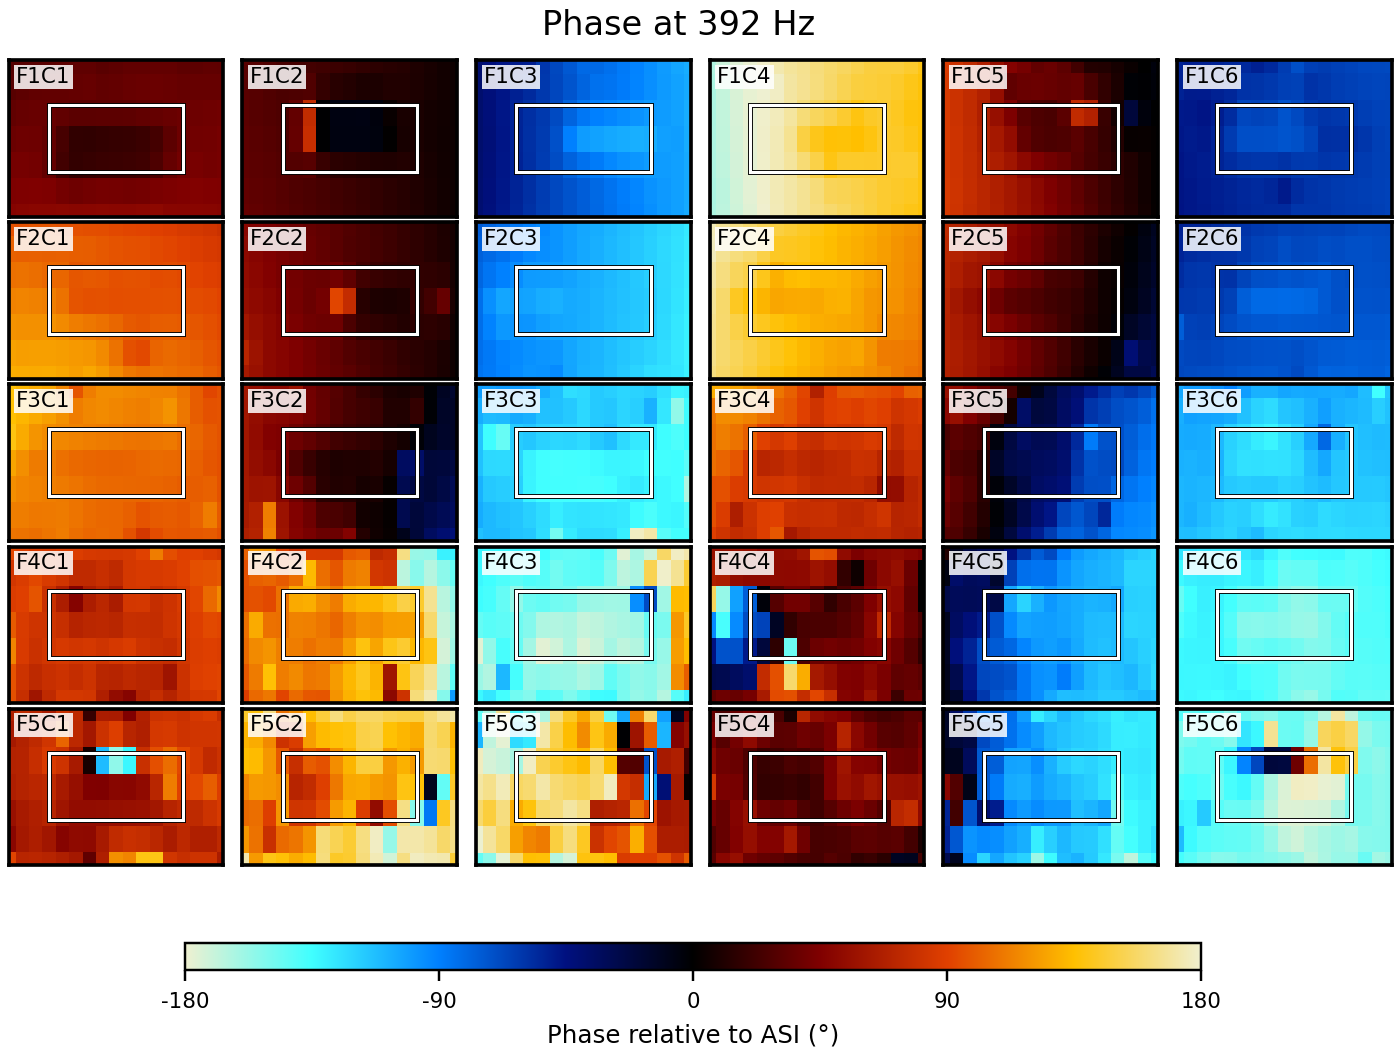
The full note follows all 30 array positions, bringing complete amplitude and phase overviews together with five examples with native section curves. A shared cyclic scale makes the phase relationships easy to compare. The surrounding measured background remains visible.
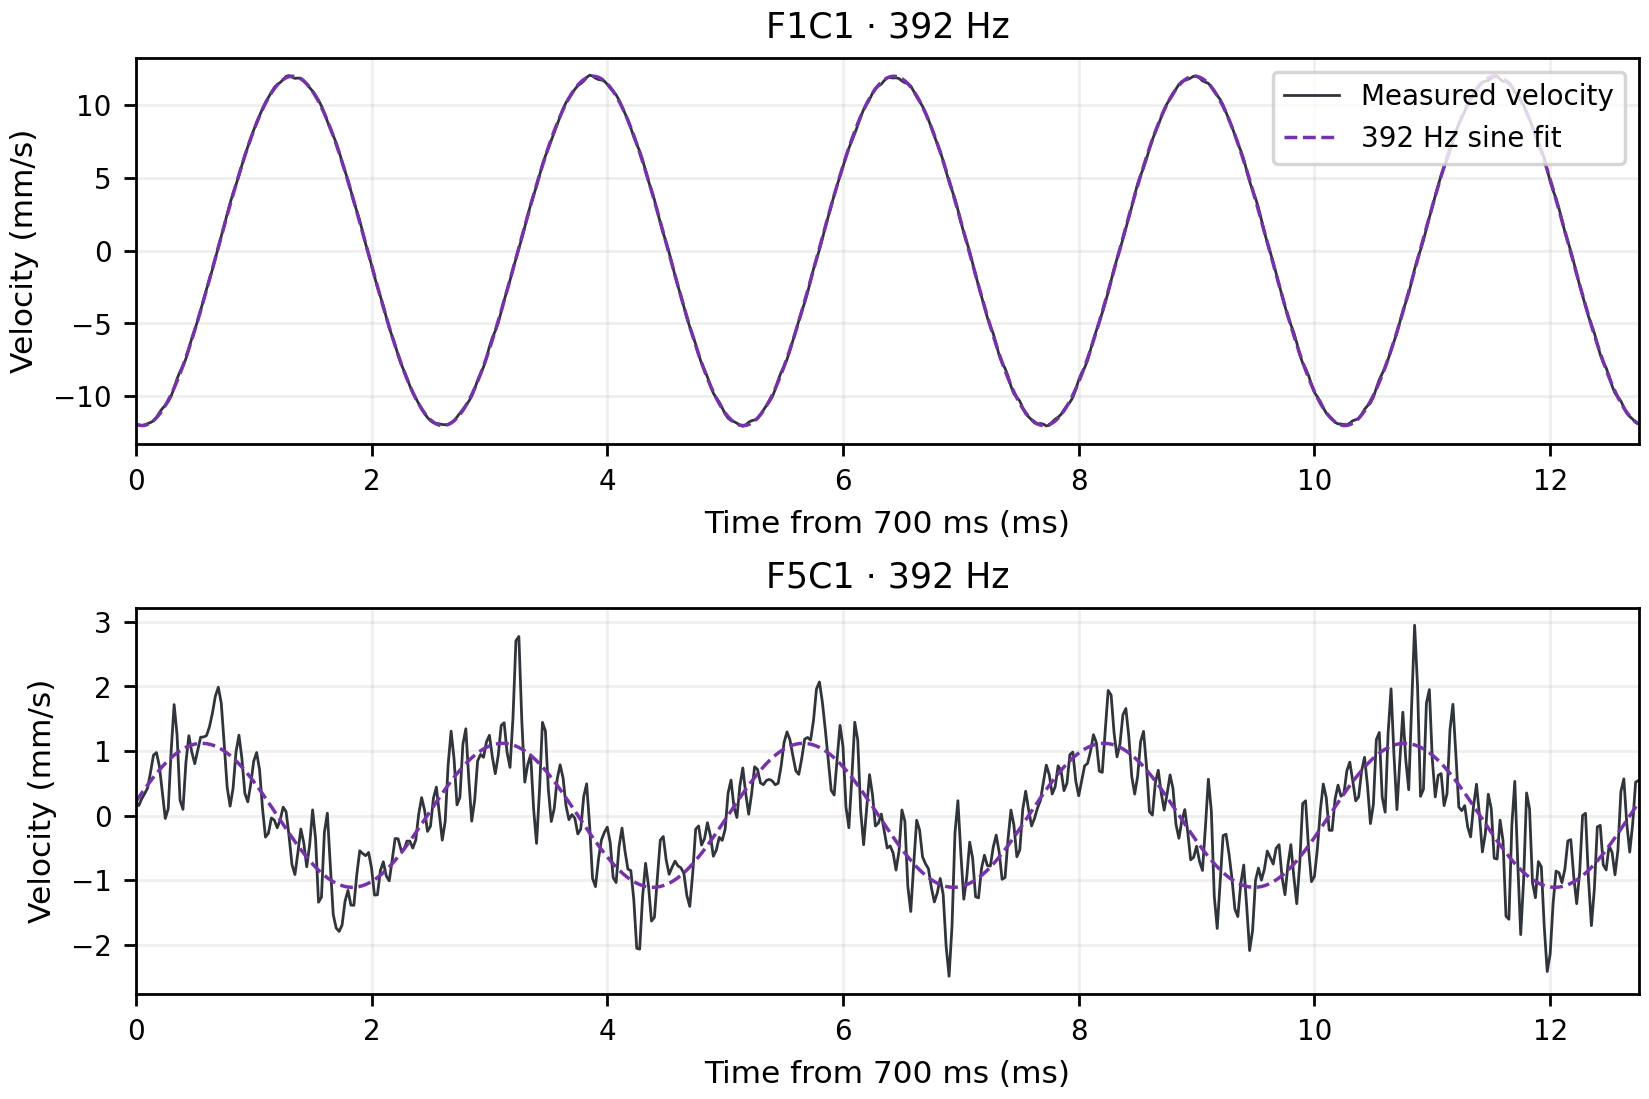
Velocity traces complement the spatial maps, showing how each measured point moves over time. The report brings clear periodic responses and more complex waveforms together, helping test engineers assess the motion behind the maps.
Compare instrument positions, viewing directions and coverage on a 3D model with OmmPlanner. Web and Pro also support optical settings and expected-signal analysis to help select the setup you will verify during acquisition.
Follow the Q-series measurement workflow.
Explore the 14-page report: amplitude and phase overviews of all 30 positions, five local examples with section curves, processing settings and numerical definitions.
Explore optical vibrometry for NVH and modal testing on panels, components and assemblies. Discuss viewing geometry and acquisition and analysis settings for your application with Ommatidia.
The maximum-to-minimum coherent-return contrast across the measured scene. It is a scene measurement, rather than an instrument dynamic-range specification.
Angular processing helps concentrate the measured response around individual features. This example compares configurations on one 392 Hz acquisition. The PDF defines the footprint measure, explains the local variations and links to the Kaiser window reference used in the analysis.
The 14-page PDF includes the test layout, optical-return characterisation, the complete measured field, overviews of all 30 positions and five selected local examples and representative velocity waveforms.
Upgrade to Ommatidia’s latest Laser RADAR technology and unlock more capability for your next measurement challenge. Whether you are expanding an existing setup or replacing an older system, we offer tailored upgrade options with discounts of up to 40%.
If you are currently using another manufacturer’s system, send us your model and measurement requirements. We will review your trade-in possibilities, identify the best Ommatidia configuration, and outline a practical upgrade path for your team.
Our AI will connect you with expert advice.