
Energy vibration monitoring
Built for: blade testing · turbine dynamics · transformer diagnostics
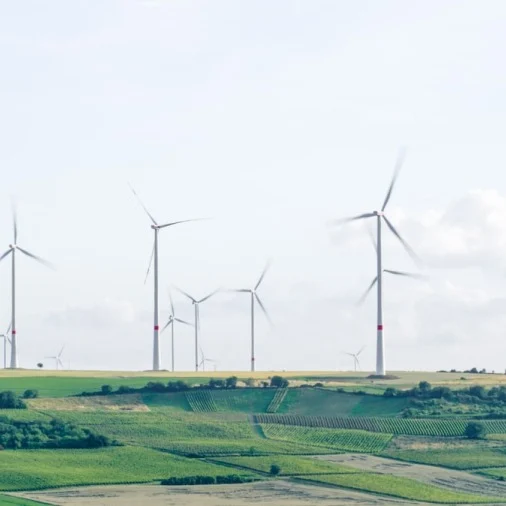
Focus the measurement on the assets that matter
Turbine response in operation
Track structural response through changing wind, rotor speed, pitch and operating conditions—with spatial evidence that supports the engineering decision.
Blade qualification and fatigue testing
Capture 3D deflection, curvature and local strain behaviour during static-load, resonance and fatigue campaigns—without loading the blade with a dense sensor installation.
Transformer vibroacoustics
Map vibration remotely on transformers and shunt reactors to support anomaly investigation, preventive maintenance and repeatable screening workflows.

Wind-turbine blade testing: in the lab and the field
Blade teams need one measurement approach that carries from static-load, resonance and fatigue rigs to field investigations on operating turbines. In the lab, capture 3D deflection vectors across the blade, resolve curvature change and map local strain for model correlation and qualification evidence.
In the field, relate structural response to rotor speed, pitch, wind and operating state. Stand-off acquisition keeps the instrument off the test article and gives the team repeatable coverage when access is limited.
Turn blade motion into structural insight
3D deflection vectors
Capture motion across the blade in three dimensions with spatially distributed measurement points.
Local curvature
Resolve changes in the blade shape along the span and around critical structural features under load.
Local strain maps
Use the measured spatial response to identify local strain behaviour for correlation, fatigue assessment and design validation.
Lab and field coverage
Apply the same non-contact approach to qualification testing, fatigue campaigns and in-service blade-response investigations.
Explore the technical evidence
Wind-turbine tower dynamics
Read the application note on structural-vibration measurement in a real wind-turbine tower, under operational and non-operational conditions.
Transformer health monitoring
Review the Q2 Laser RADAR application note for non-contact, stand-off vibration mapping on transformers and shunt reactors.
Field-ready transformer diagnostics
See an Ommatidia deployment across operational testbeds, from buzzing transformers to high-frequency electric motors.
Choose the right Q-Series configuration
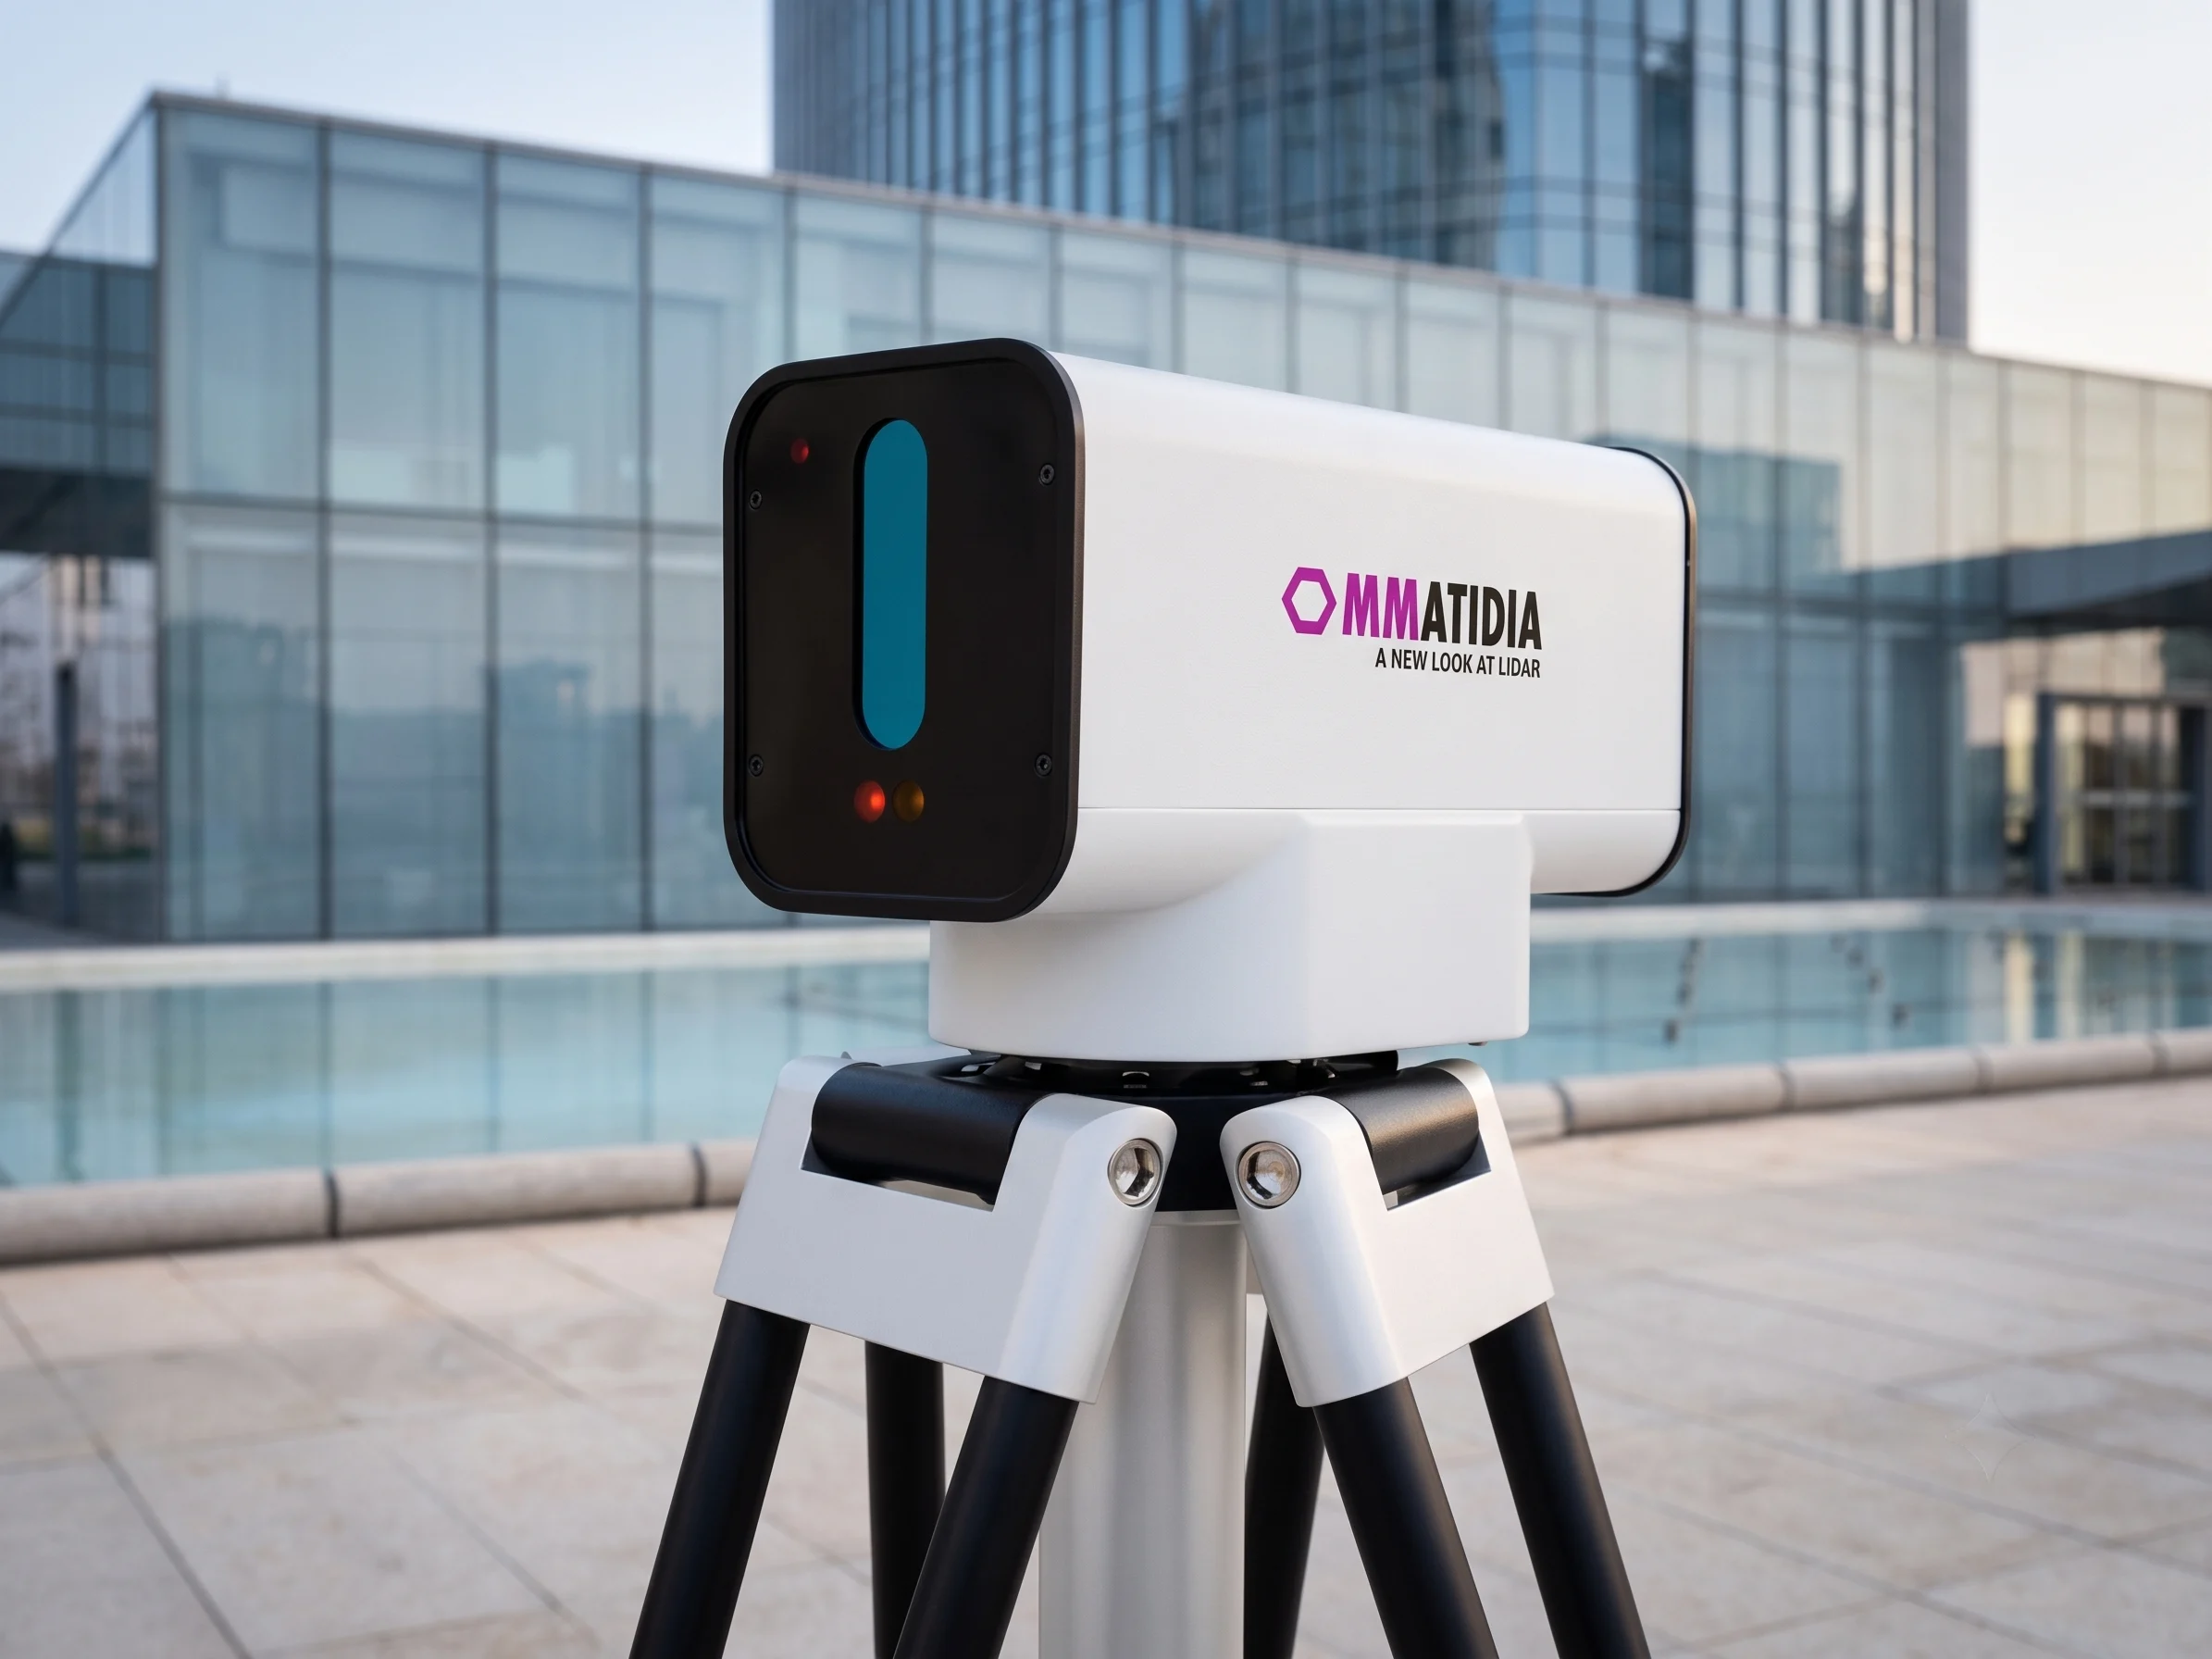
Q1 Laser RADAR
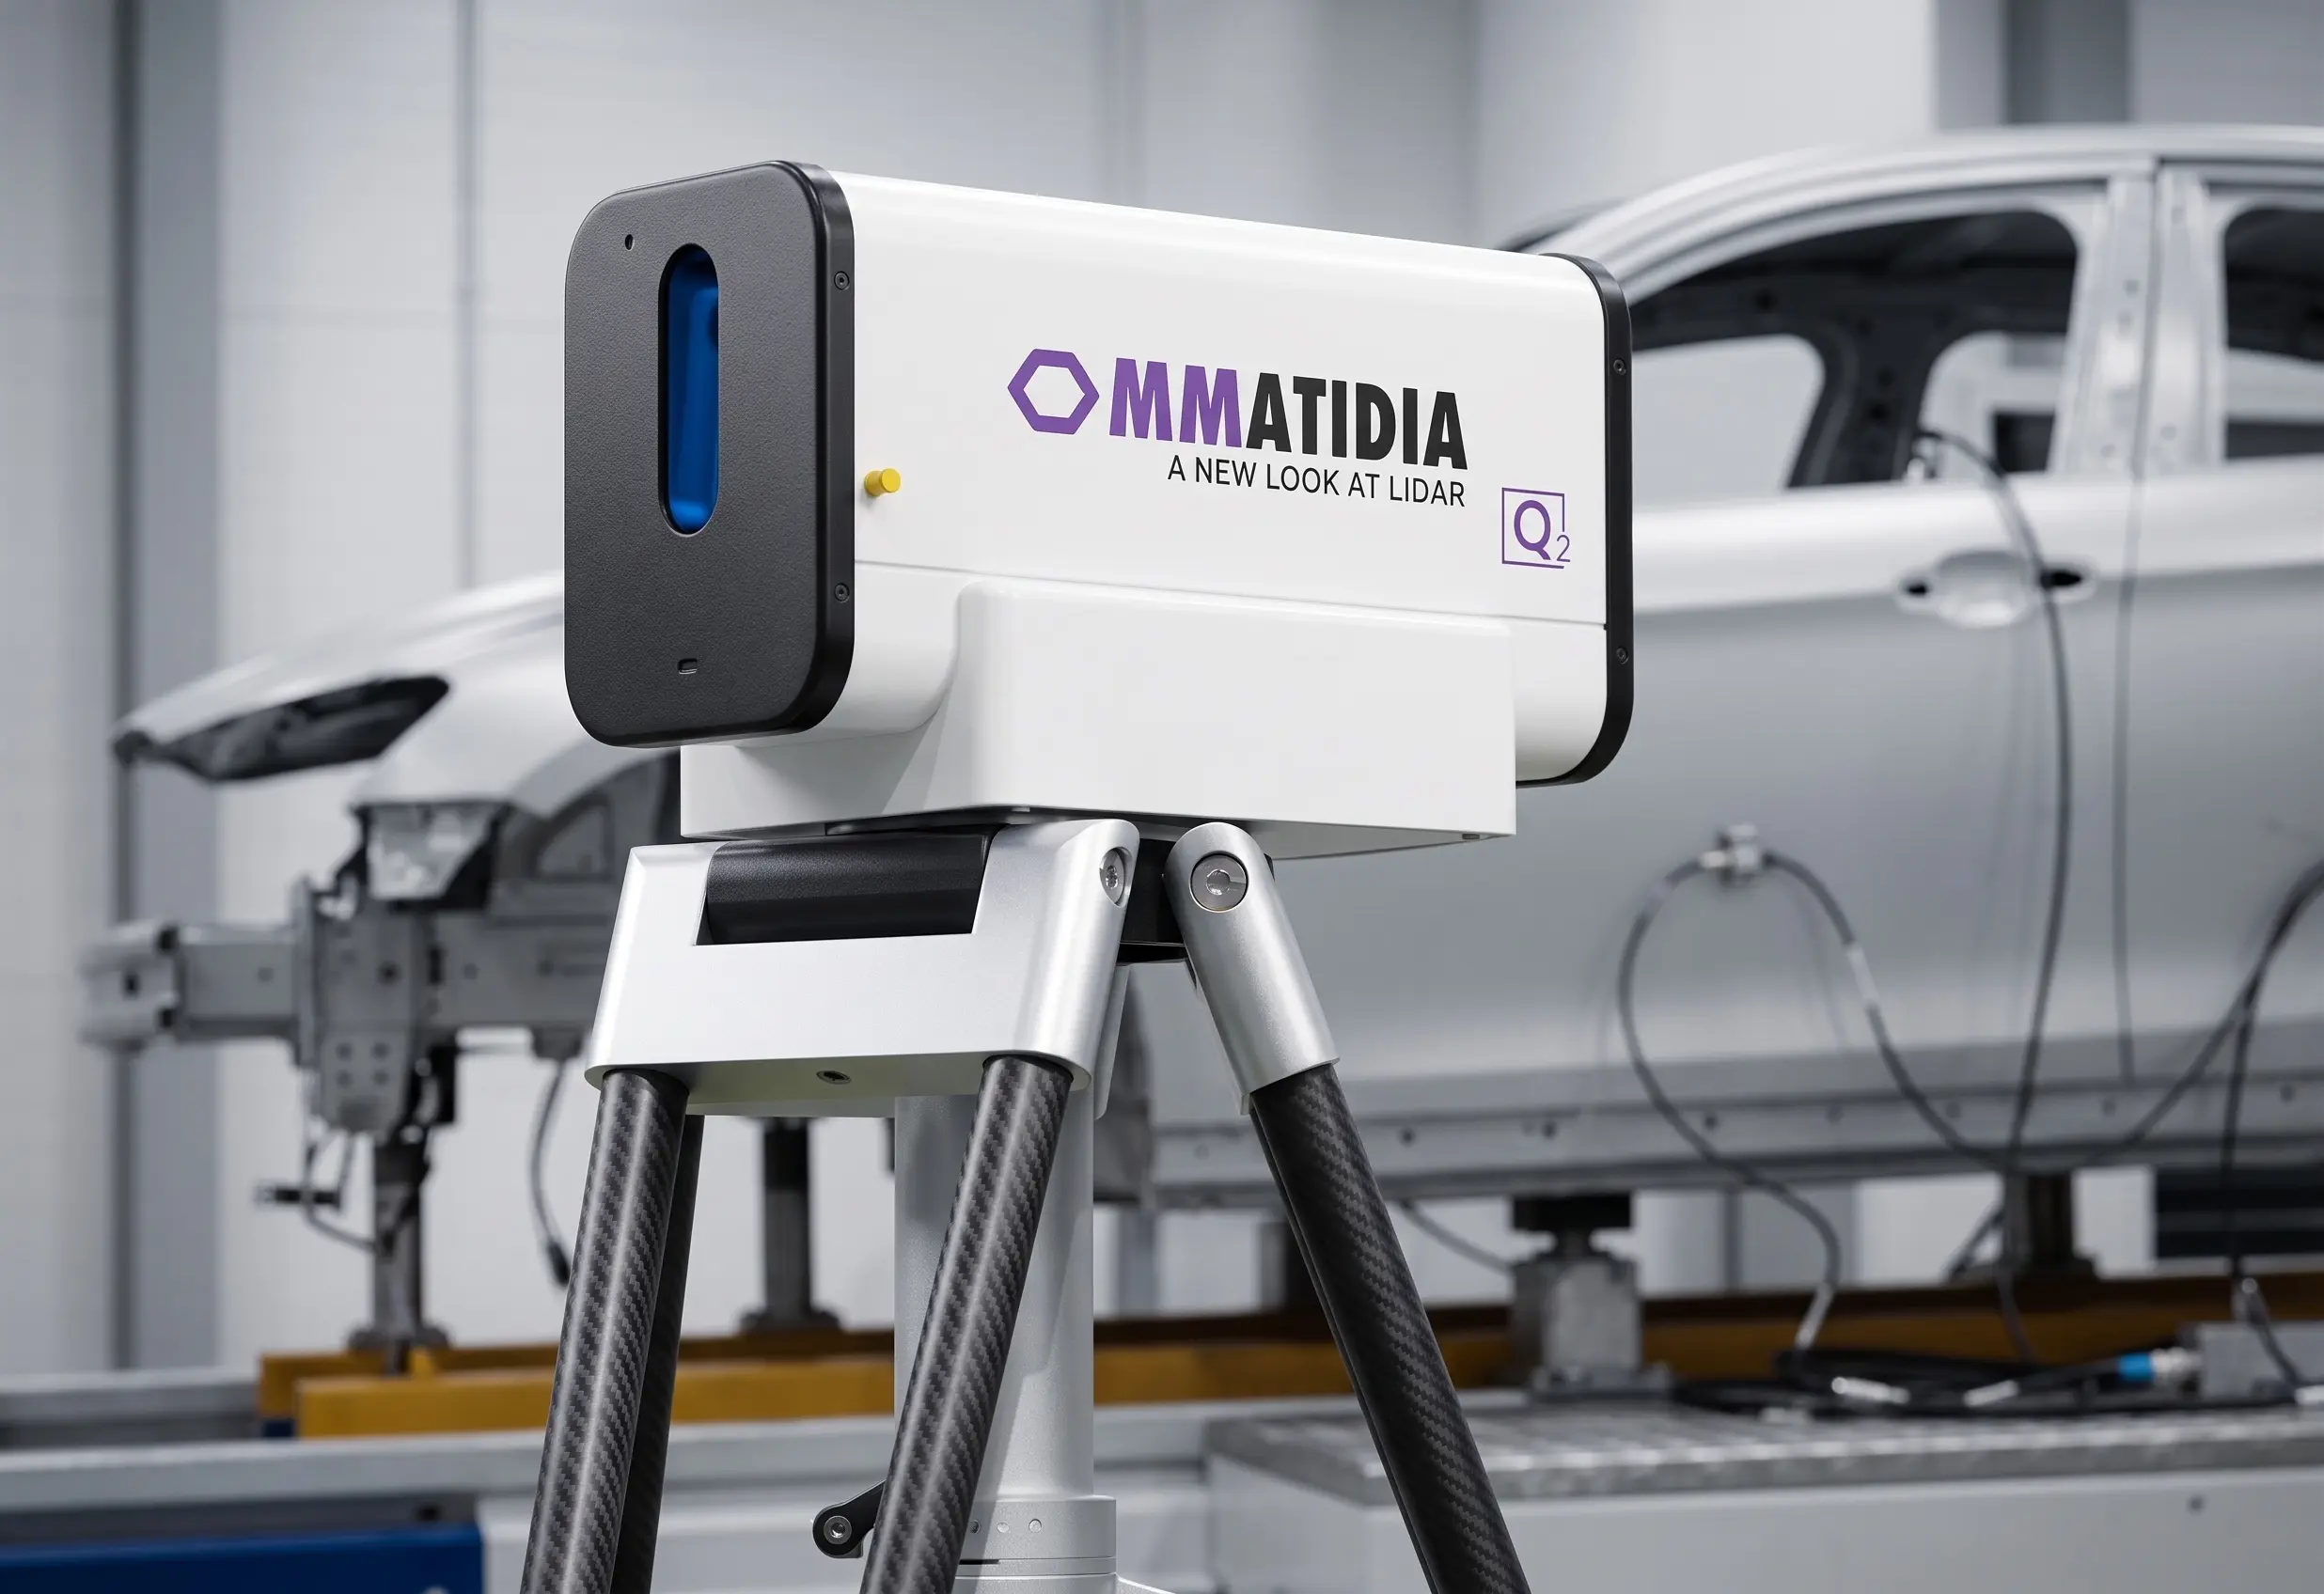
Q2 Laser RADAR

Q1S Laser RADAR
Energy vibration monitoring: common questions
Yes. Laser RADAR captures wind-turbine vibration from a stand-off position and maps the response across selected points. Our applications team selects the optical setup for your measurement distance, coverage, frequency range and operating conditions.
Full-field measurement delivers spatial 3D deflection and vibration vectors and supports curvature or strain analysis from registered geometry. Teams use this evidence for modal correlation, fatigue-test interpretation and targeted follow-up across the blade.
Remote mapping compares the response of transformers or shunt reactors without a dense installed sensor network. Repeatable maps reveal response changes, focus anomaly investigation and give engineering teams a clear route from screening to detailed assessment.
Selected Q-Series Laser RADAR configurations combine non-contact 3D geometry and laser Doppler vibrometry in one workflow. Registered measurement points connect shape and motion, giving the team spatial context for vibration analysis and model correlation.
Define the asset and access, distance, surface, point density, frequency and motion range, operating environment, campaign duration, reference channels and required outputs. These inputs identify the Q-Series platform, optical setup and data workflow for campaign or continuous monitoring.
Repeatable measurements at comparable rotor speed, pitch, wind and load reveal changes in structural response and focus follow-up work. Trend maps, reference conditions and uncertainty tracking give teams a consistent basis for maintenance and engineering review.
Plan a more complete energy measurement campaign
Tell us about your asset, access conditions and the response you want to understand. We will help you define the right non-contact workflow and Q-Series configuration.