See how a complex part responds, feature by feature. In this brake-disc study, Q2 connects optical geometry with 2,804 measured vibration locations and response analysis from 200 Hz to 4 kHz.

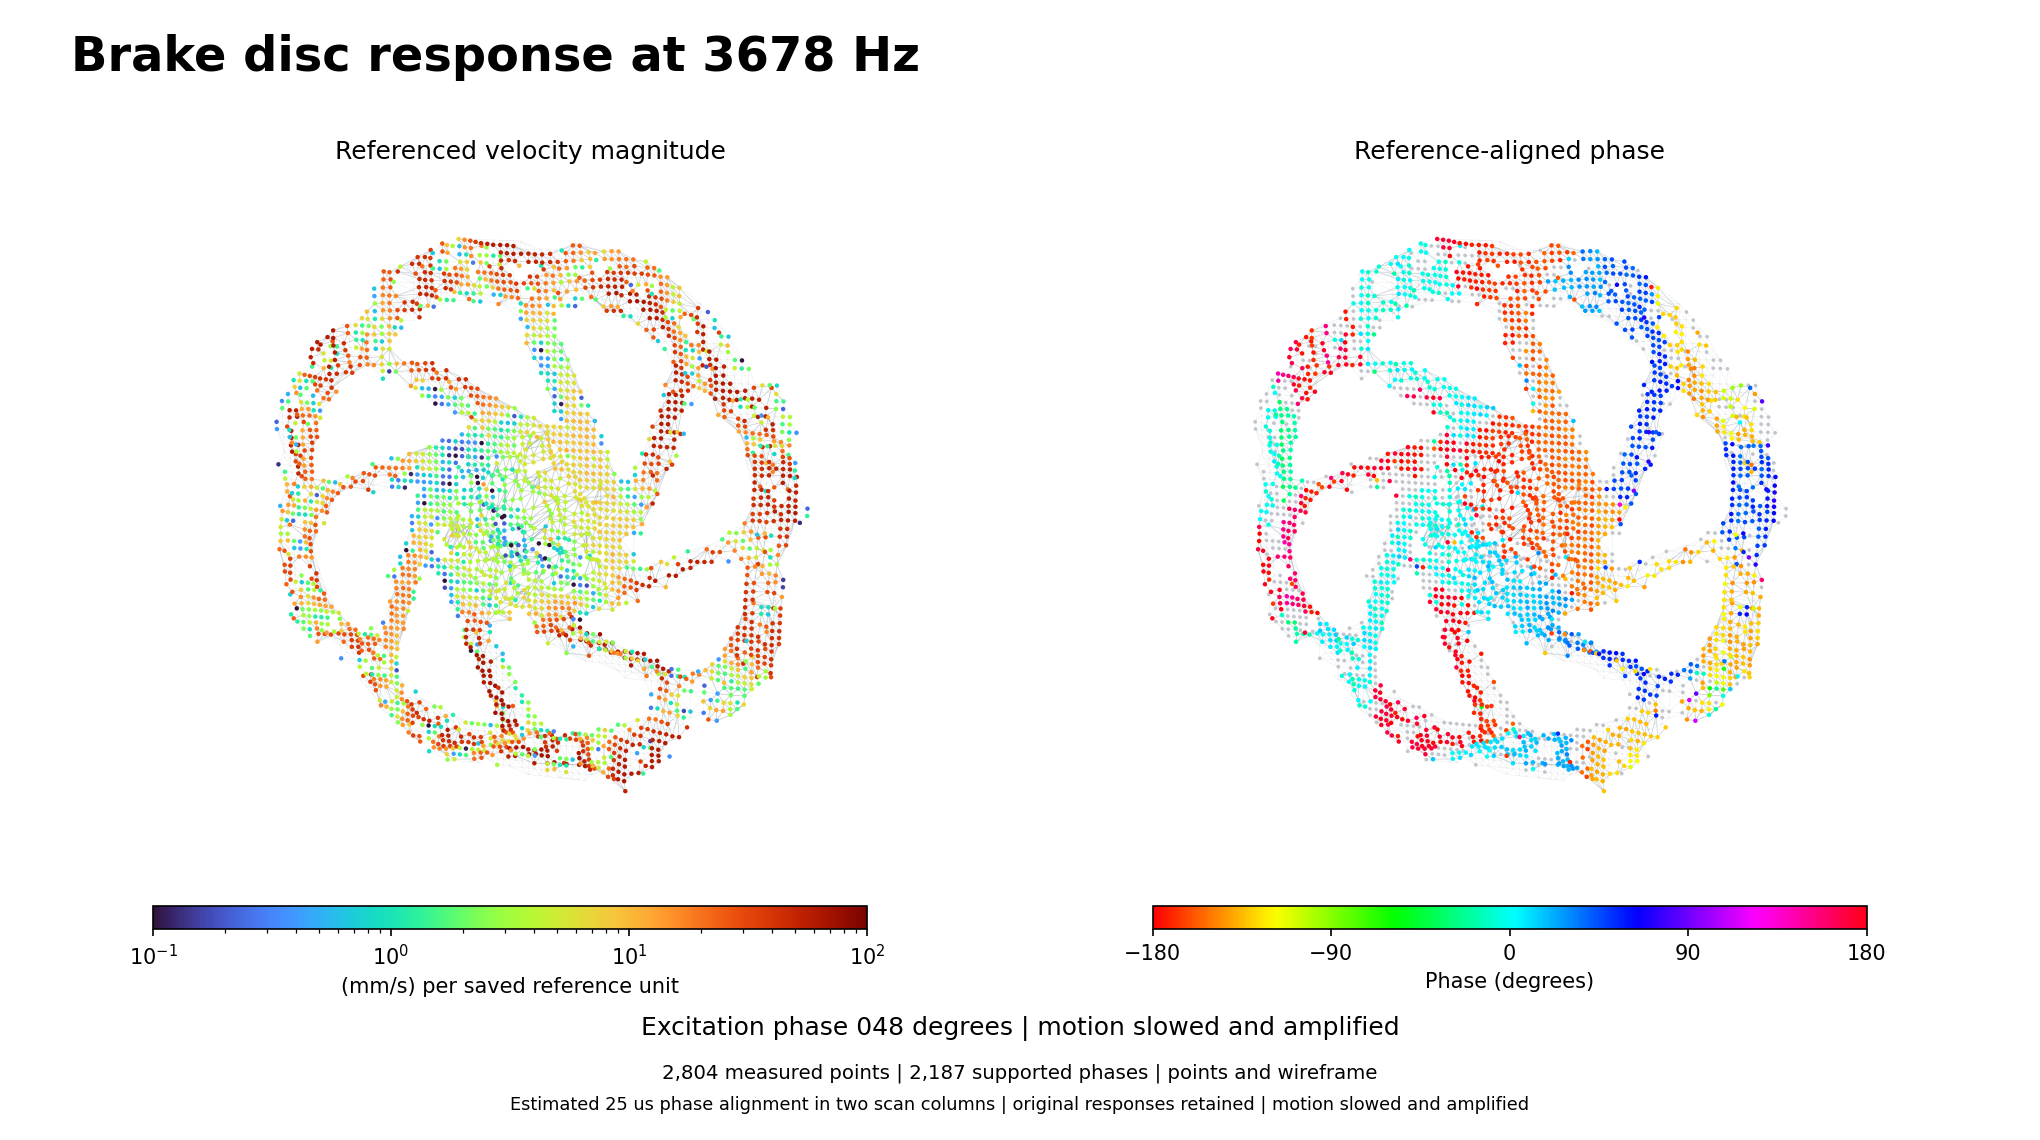
Measured brake-disc velocity magnitude and reference-aligned phase at 3678 Hz, shown at 2,804 registered locations.
Measured brake-disc response at 3678 Hz. Point colours show referenced magnitude and phase; the wire connections link neighbouring measured locations.

Connect geometry with measured vibration

The ring, spokes and central assembly can be examined in one spatial view. Q2 combines optical ranging and laser vibrometry to place each recorded response in the context of the component. Here, the geometry comes from an optical depth survey and photographs, without an imported CAD file.

Q2 records 45 optical velocity channels at the same time. Some minutes of parallel recording already contain many local time histories; automated positioning extends that coverage across the component.

Analyse brake-disc vibration through 4 kHz

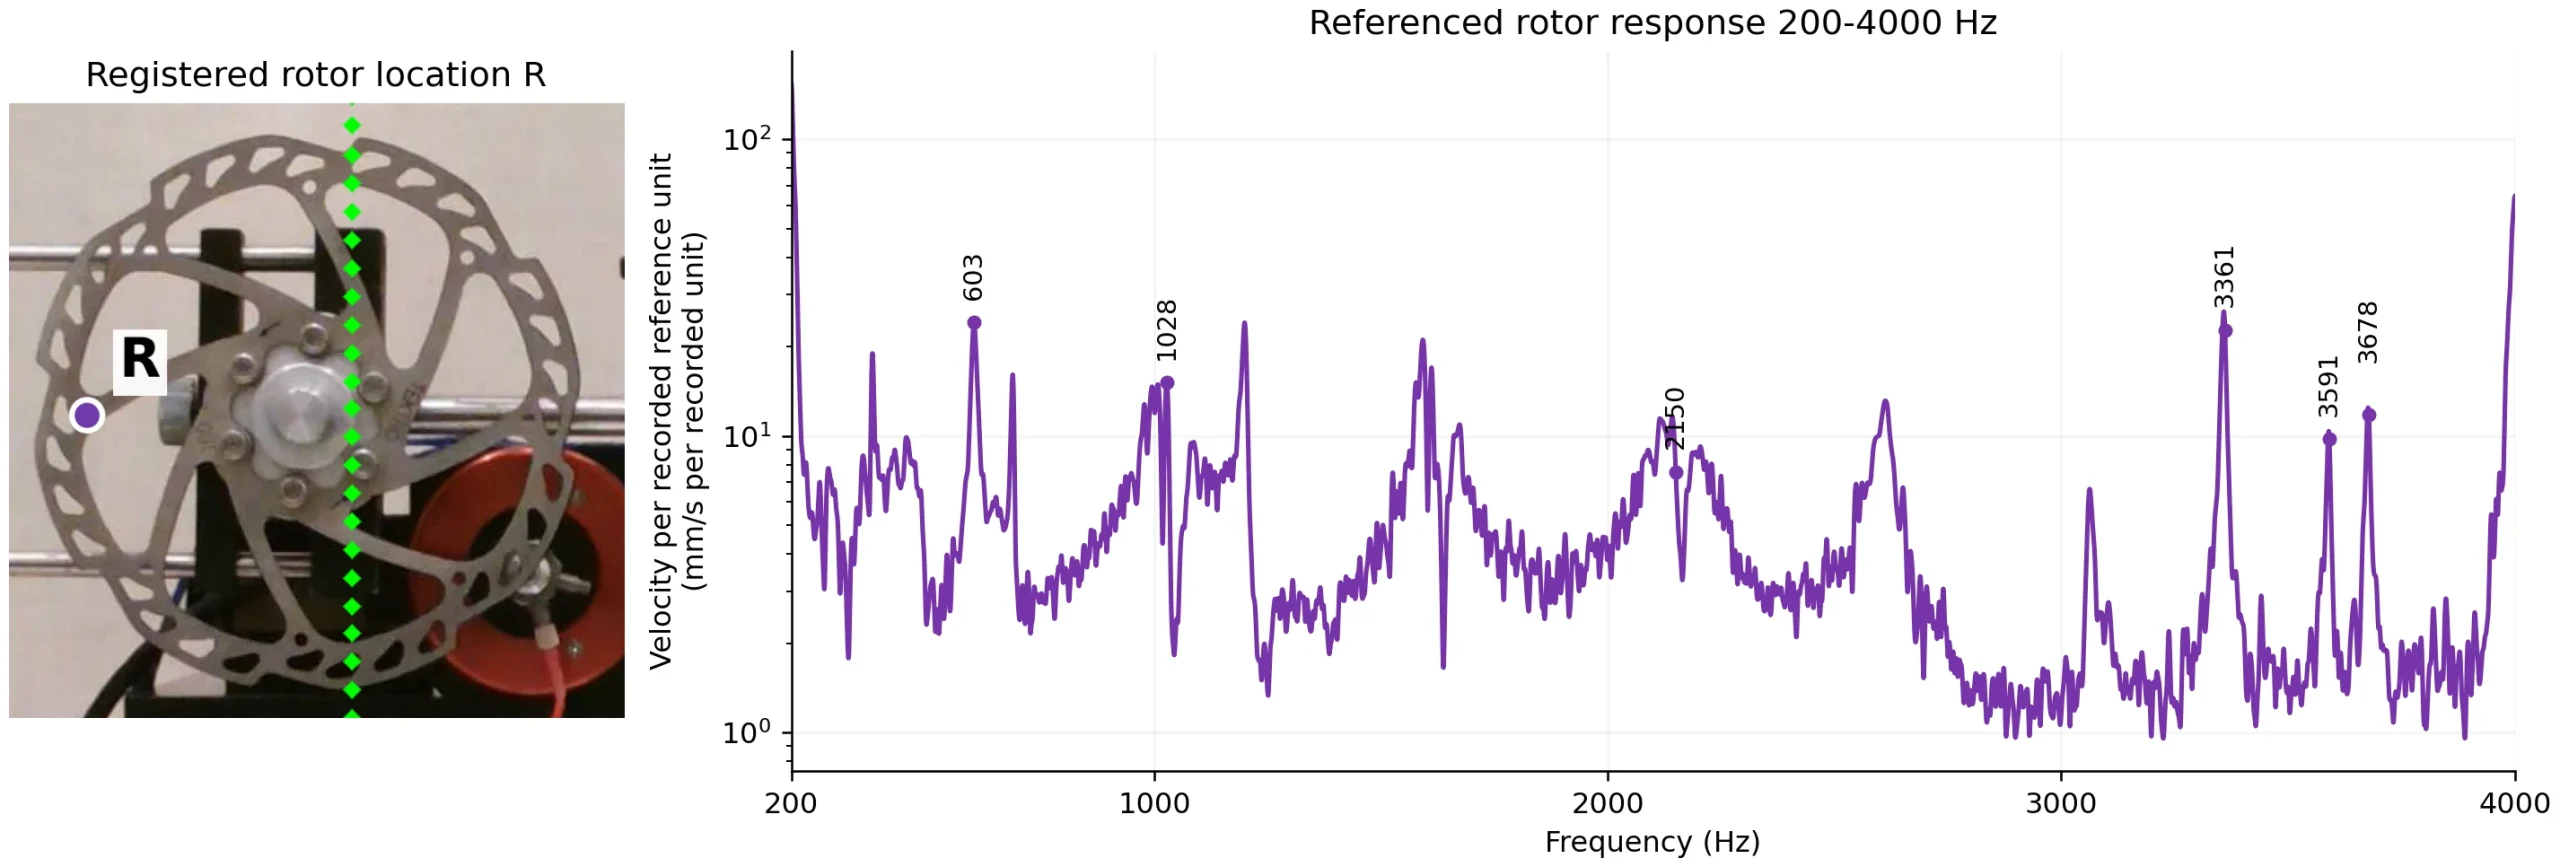
The case analyses the response from 200 Hz to 4 kHz. Six selected spatial patterns show how magnitude and phase change across the disc, with the highest illustrated pattern at 3678 Hz. The response curve and maps connect frequency behaviour to physical features.

Referenced velocity response at rotor location R from 200 to 4000 Hz, with six selected frequencies and 2 Hz display smoothing.
Referenced velocity response at rotor location R over 200-4000 Hz. Six frequencies mark the illustrated response patterns; the display uses 2 Hz smoothing.

2,804 measured locations across the component

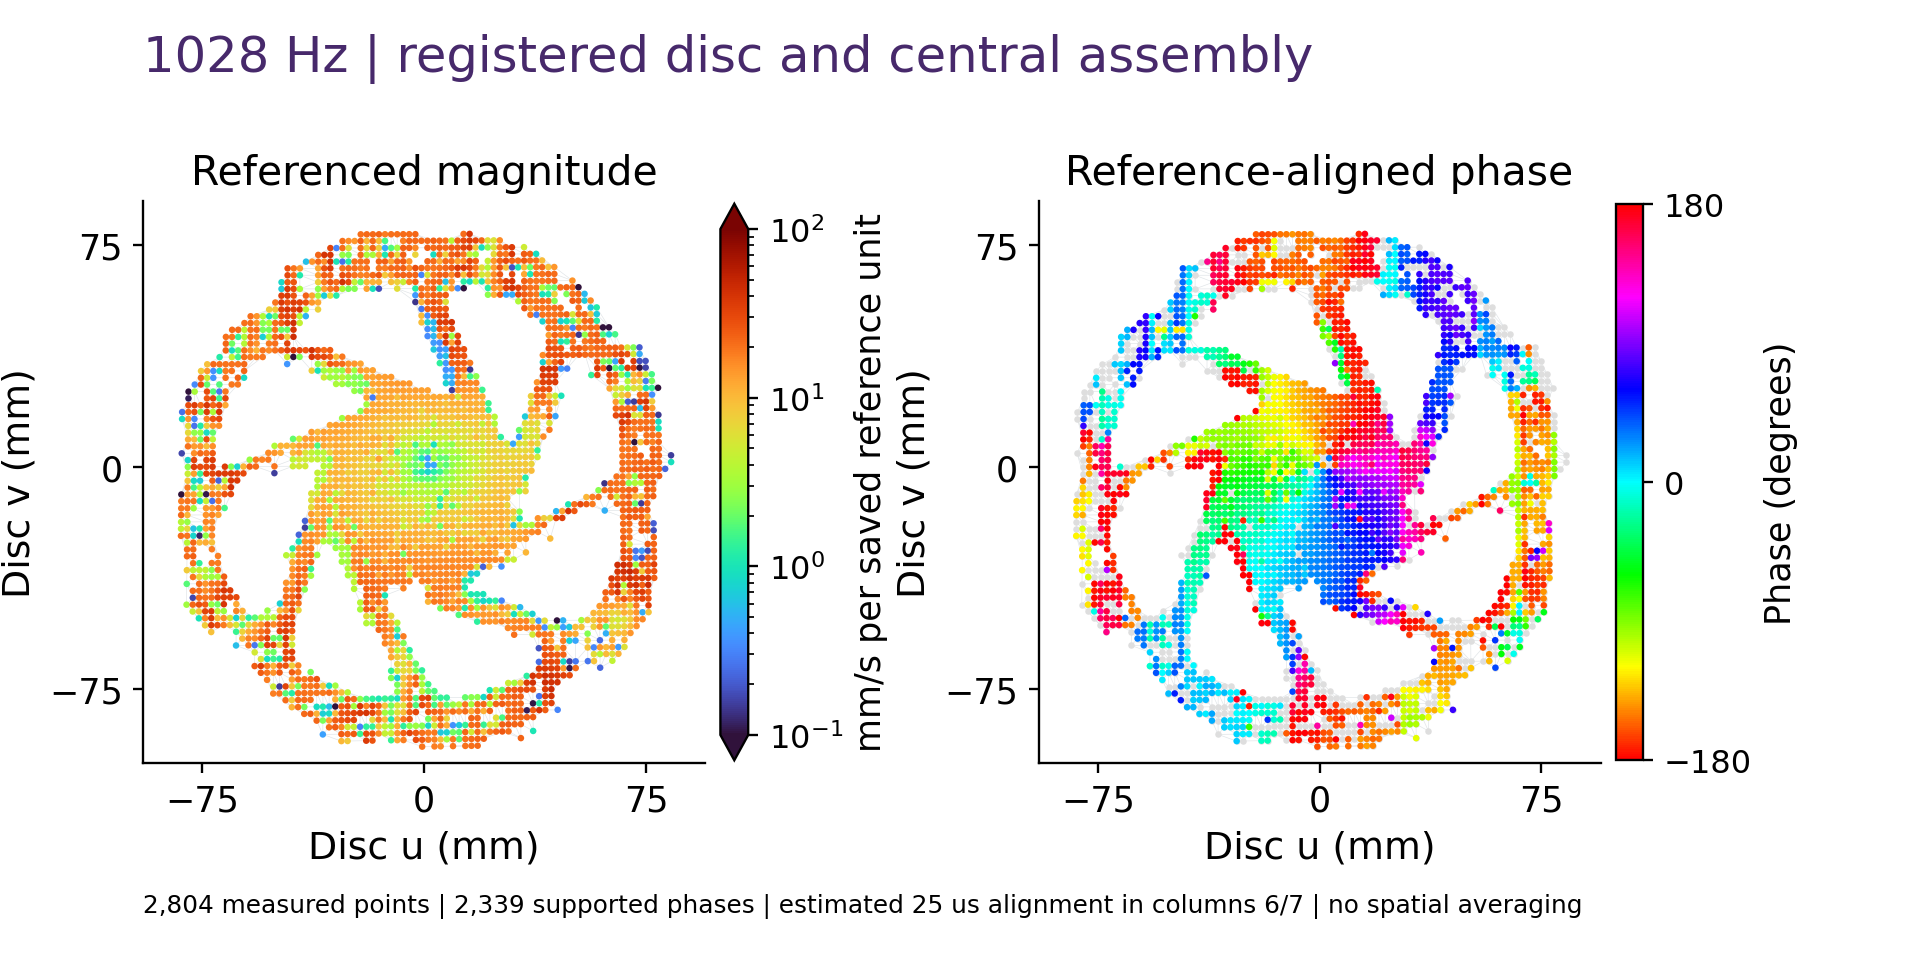
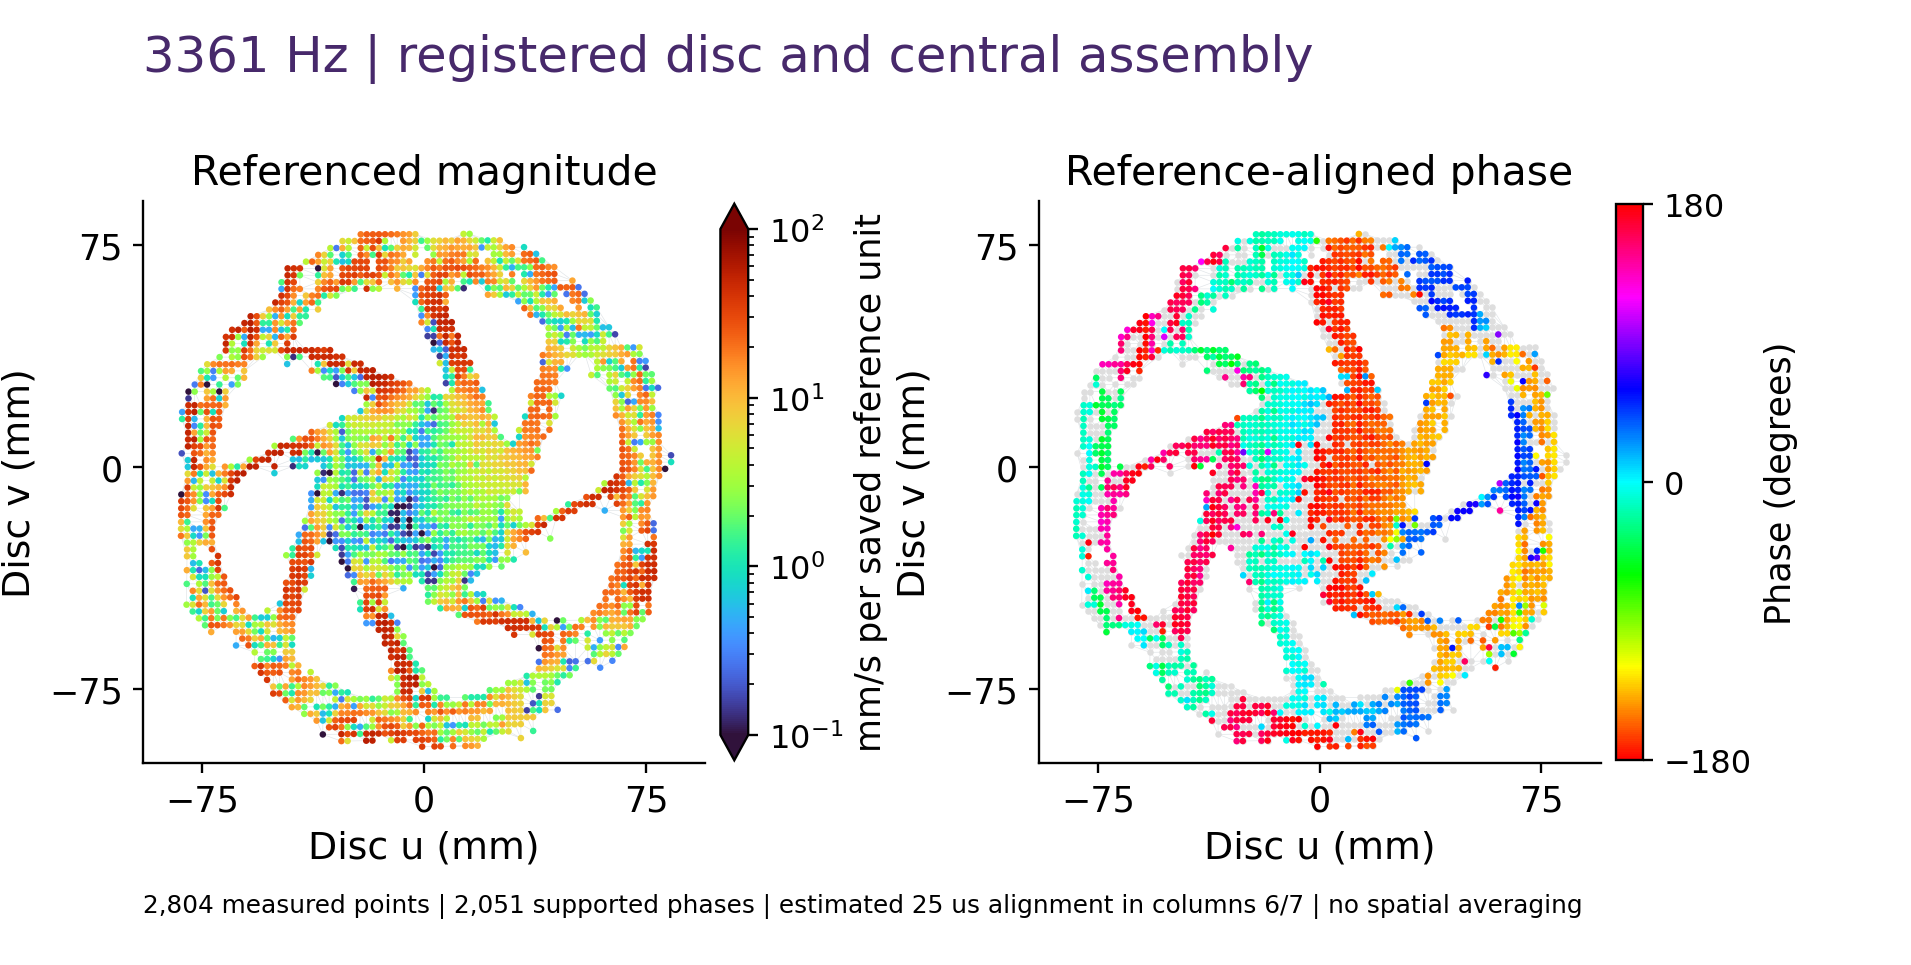
Each displayed location contributes its own measured response. Across 2,804 measurement locations, the maps show how different features respond and how phase changes across the assembly. This dense spatial evidence helps engineers investigate local behaviour directly on the part.

Registered measured velocity magnitude and reference-aligned phase across the brake disc at 1028 Hz.
Referenced magnitude and reference-aligned phase at 1028 Hz.
Registered measured velocity magnitude and reference-aligned phase across the brake disc at 3361 Hz.
Referenced magnitude and reference-aligned phase at 3361 Hz.

Watch the measured brake-disc response

Watch the six measured response patterns in the 24-second video. Motion is slowed and amplified separately at each frequency so the changes in spatial behaviour are easy to follow.

Turn spatial response into engineering decisions

A dense measured view helps engineers locate response concentrations, follow how neighbouring features move and compare the observed behaviour with structural models. This brake-disc study shows how Q2 links complex geometry with real vibration data across the 200 Hz to 4 kHz analysis band. It gives teams a concrete basis for model correlation, focused investigation and planning the next measurement.

Explore the complete measurement

The six-page application note explains the test, spatial registration, 200 Hz to 4 kHz referenced response, six response maps and measurement conventions. Share your details to access the full PDF.

Continue your measurement workflow

Copyright © 2026 Ommatidia LiDAR S.L. All rights reserved.

Ommatidia Upgrade & Trade-In Program

Upgrade to Ommatidia’s latest Laser RADAR technology and unlock more capability for your next measurement challenge. Whether you are expanding an existing setup or replacing an older system, we offer tailored upgrade options with discounts of up to 40%.

If you are currently using another manufacturer’s system, send us your model and measurement requirements. We will review your trade-in possibilities, identify the best Ommatidia configuration, and outline a practical upgrade path for your team.

Discuss your upgrade or trade-in